
Neometric Location Insight
Capstone Project | Web Product Design
Neometric Location Insight
Capstone Project | Web Product Design
Quick Facts:
Role:
UX design lead
Time:
Fall, 2014
Client:
Neometric Inc (a Pittsburgh based start-up | Master’s degree capstone project)
[Skills]
Methods:
Service design, Agile Development, Wireframing, Rapid prototyping, Personas & scenarios, Lean UX, Experience map, Think-aloud protocol, Usability test
Tools:
Pen & paper, Illustrator, HTML5/CSS3, Javascript (D3 library), Python (Django framework)
Deliverable:
Working website demo, Presentation, White paper of the service, Final poster

Quick Facts:
Please see previous slide
Opportunity: Currently, many small-to-medium businesses have limited ability to make data-driven decisions. Instead, these businesses base many of their major decisions on intuition or limited data sets, due to prohibitive costs, technology phobia, or a general lack of awareness. Often, business owners can mis-interpret trends or habits of their customers; Neometric Inc is the emerging company that aims to eliminate the guess-work in running a small business.
Problem statement: Small-to-medium companies who are looking to expand their business face enormous hurdles when picking locations, especially in new, unfamiliar areas.

Is there a way to quantify the likelihood of profitability of a given location, using publicly available and demographic information?
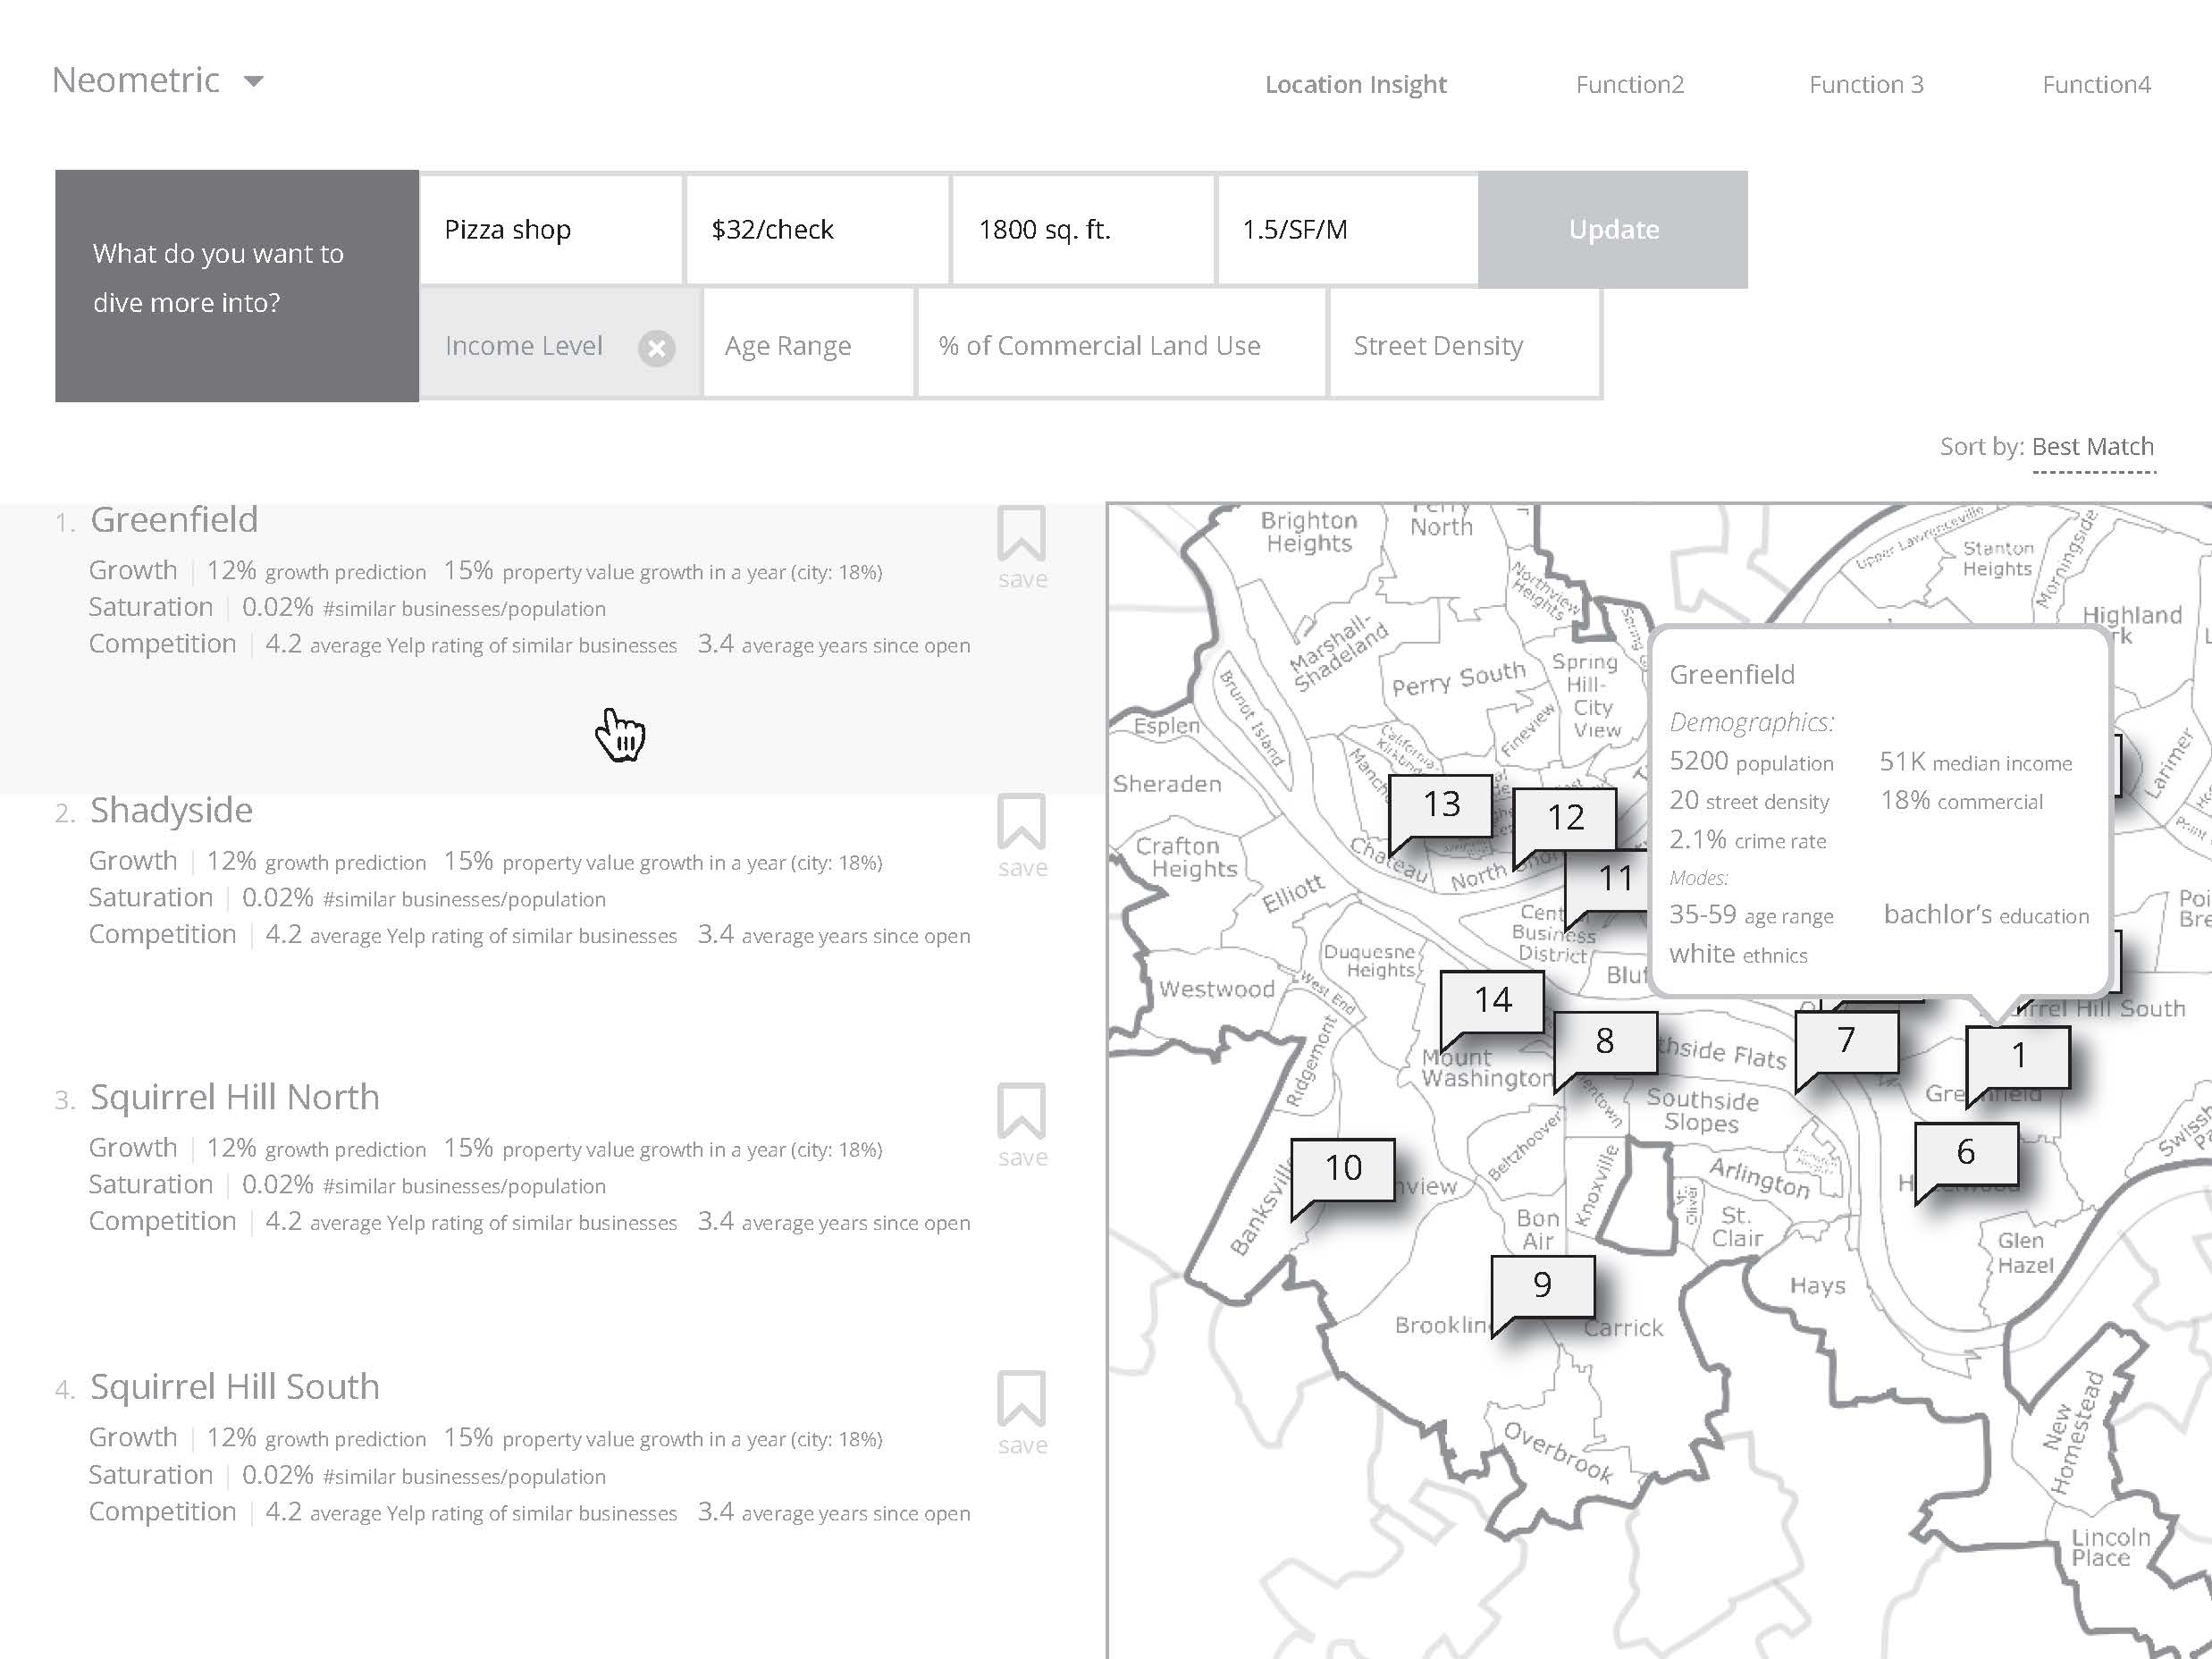
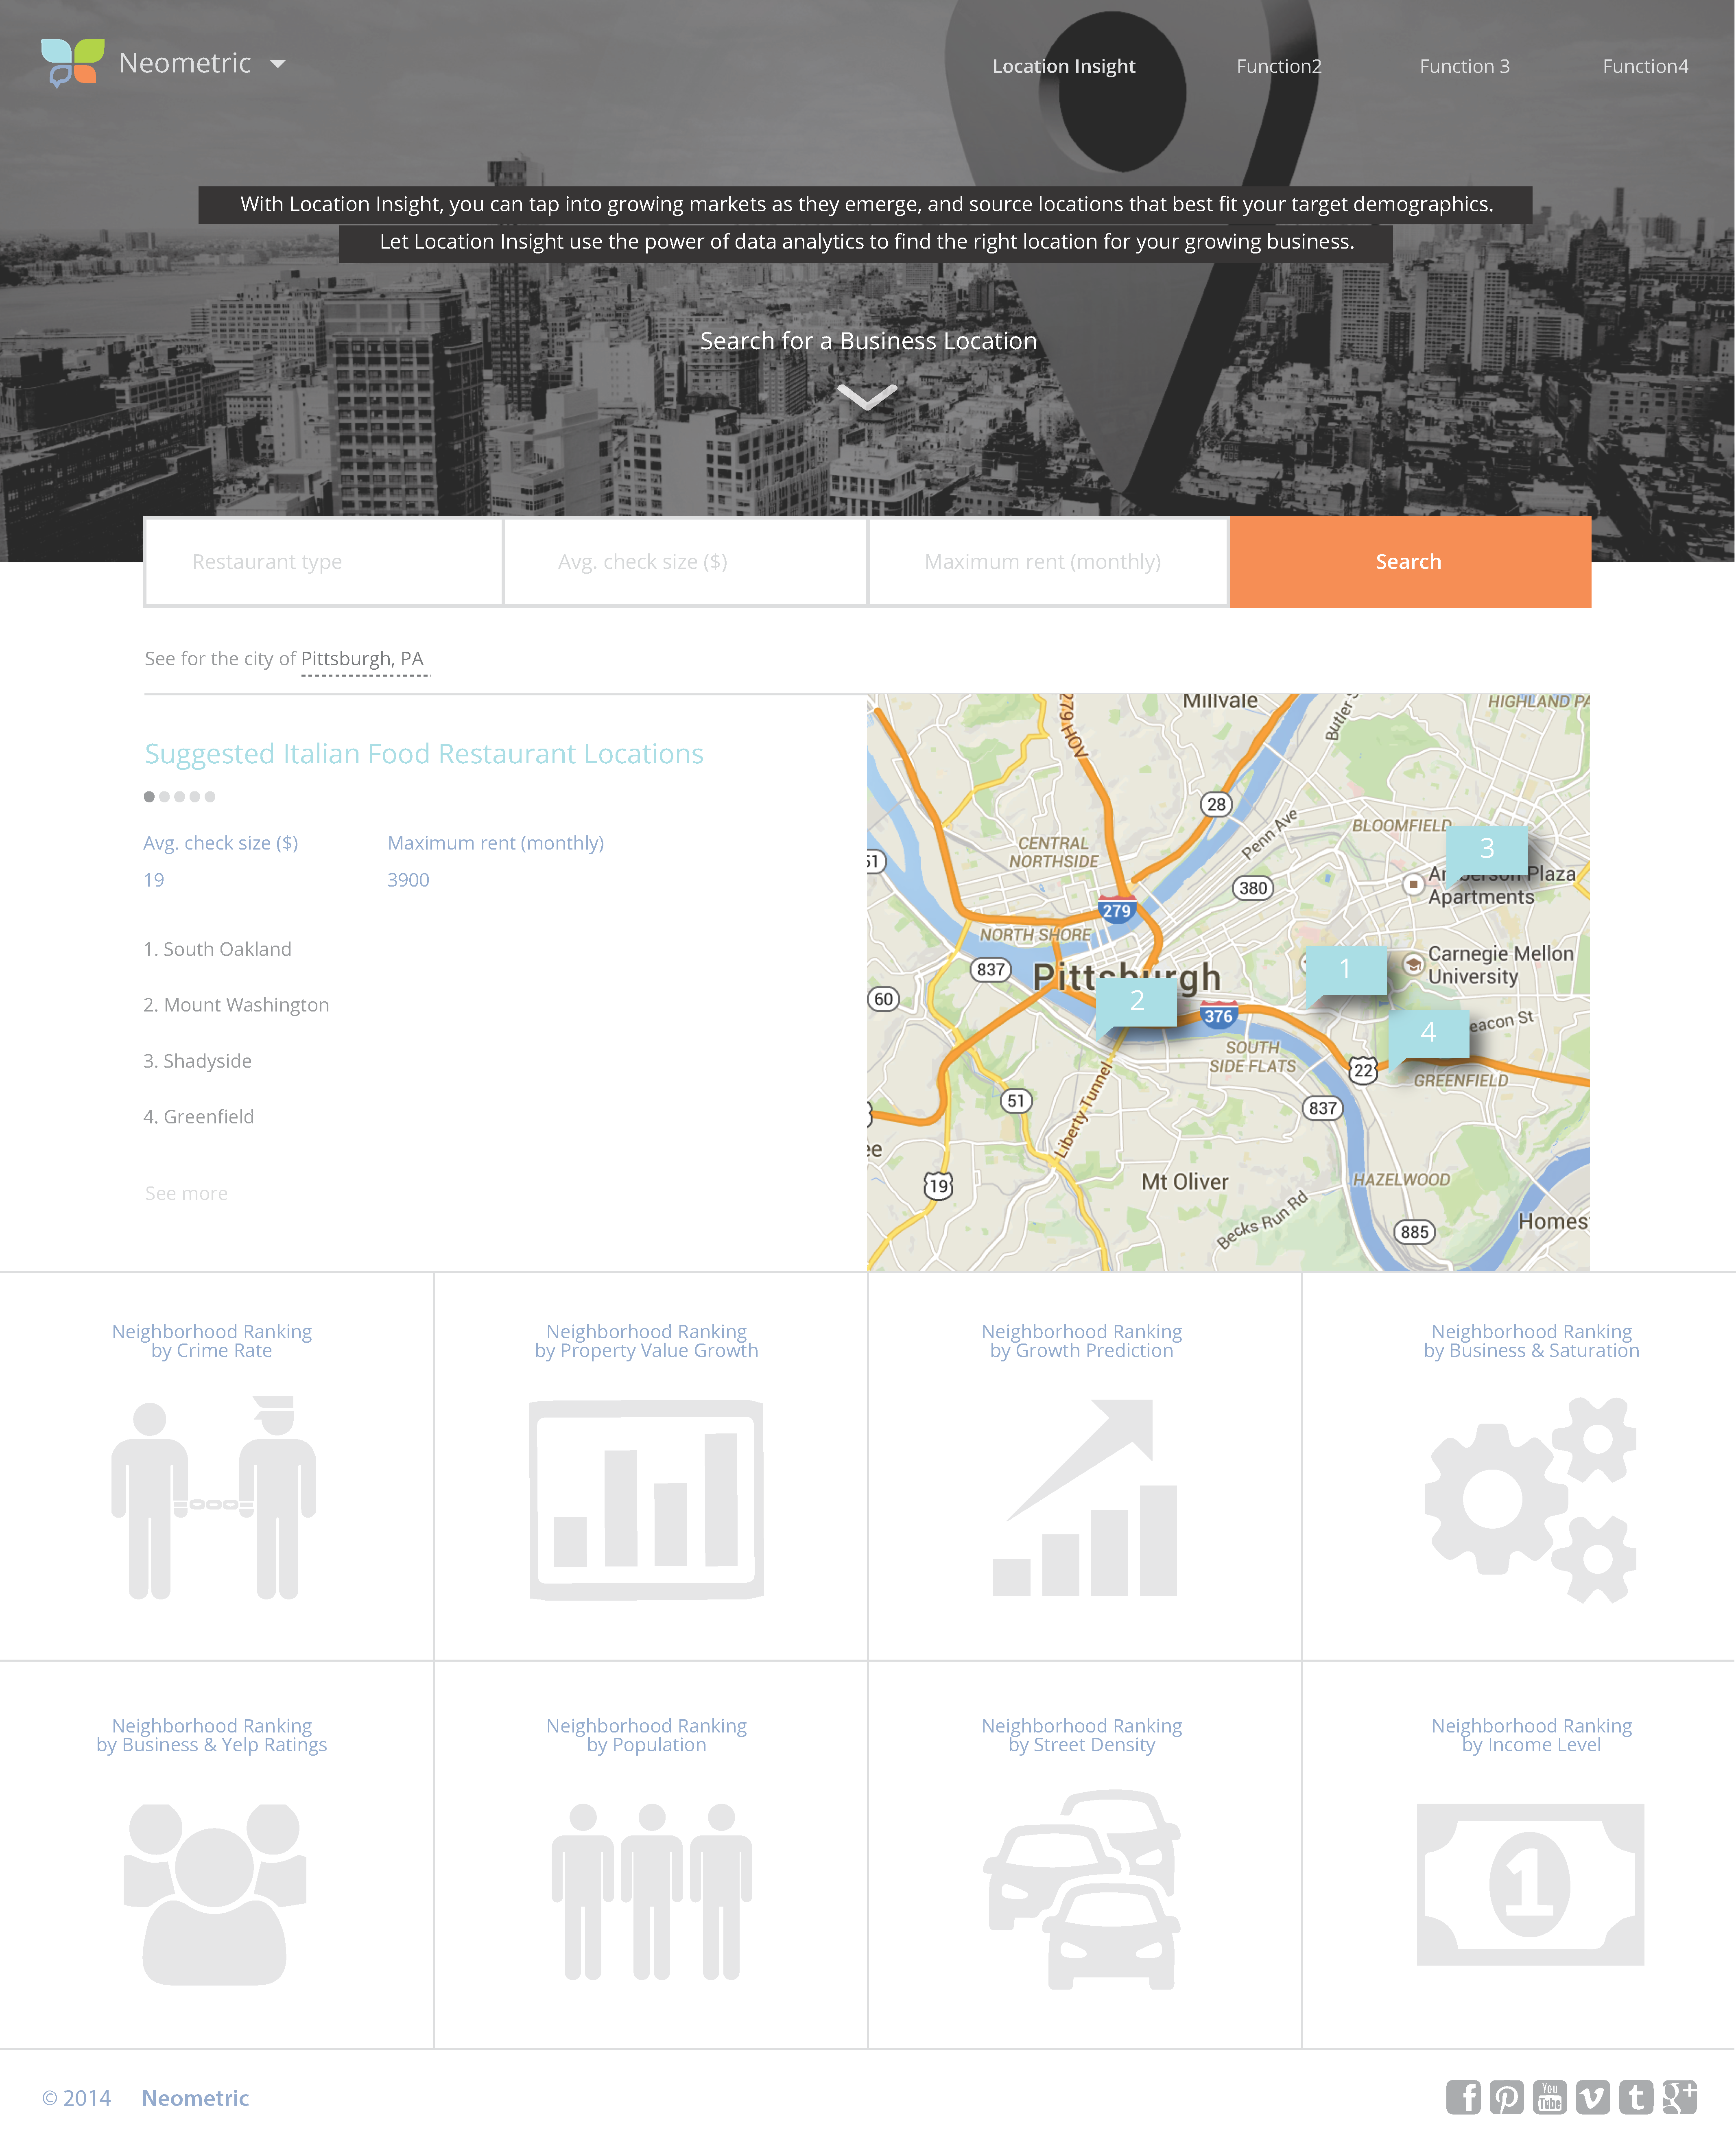
Introducing the solution – LOCATION INSIGHT: It’s a web-based product provides a user with the necessary information needed to determine where to expand a business location. Collecting voluntary user information such as menu pricing, Location Insight will perform predictive analytics to best-match user input to potential geographical areas. The service is based on publicly available data (APIs from Yelp!, Zillow and the Census Bureau), instead of proprietary information; the output will be displayed through simple tabular and map-based visuals, to appeal to non-technical users.
Neometrics Inc. and students at Carnegie Mellon University School of Information Systems Management is working together to make this happen.
Research

Research synthesis
Currently small-to-medium businesses do not have affordable comprehensive analytics tools available to them to leverage “big data” in their decision-making process. We found in the current market several tools that aim to solve problems based on user-informed data, and explored relevant service features and business aspects of those potential competitors. As we discovered, tools that are successful in similar service area have several things in common: service with clear target users, output displayed based on predictive analytics, aesthetically pleasing data visualizations, potential results and medium results that are visually appealing.
These informed us the direction to identify our product, with respect to a reasonable functional scope, freemium/premium value flow, and service requirements.

SMB, typically local chains who are expanding but have not invested in the technology necessary to help them scale.

The potential user for this product is a small-to-medium business on the cusp of expanding that has a basic understanding of technology. It is a very easy-to-identify group within the SMB market. As shown in the market analysis diagram to the right, the potential customer for this product would be limited to a company similar to Big Burrito in both size and energy.

Users need solutions to help them better understand their business potential and assist in making key decisions involving:
- Locations for relocation and/or expansion
- Employee productivity
- Customer demographics and purchasing behavior
- Sales gaps
Considering the competitive analysis findings, we want to focus on business relocation/expansion with respect to our project time limits, as this type of problem still requires combinations of data criteria that have not yet been evaluated by similar products.

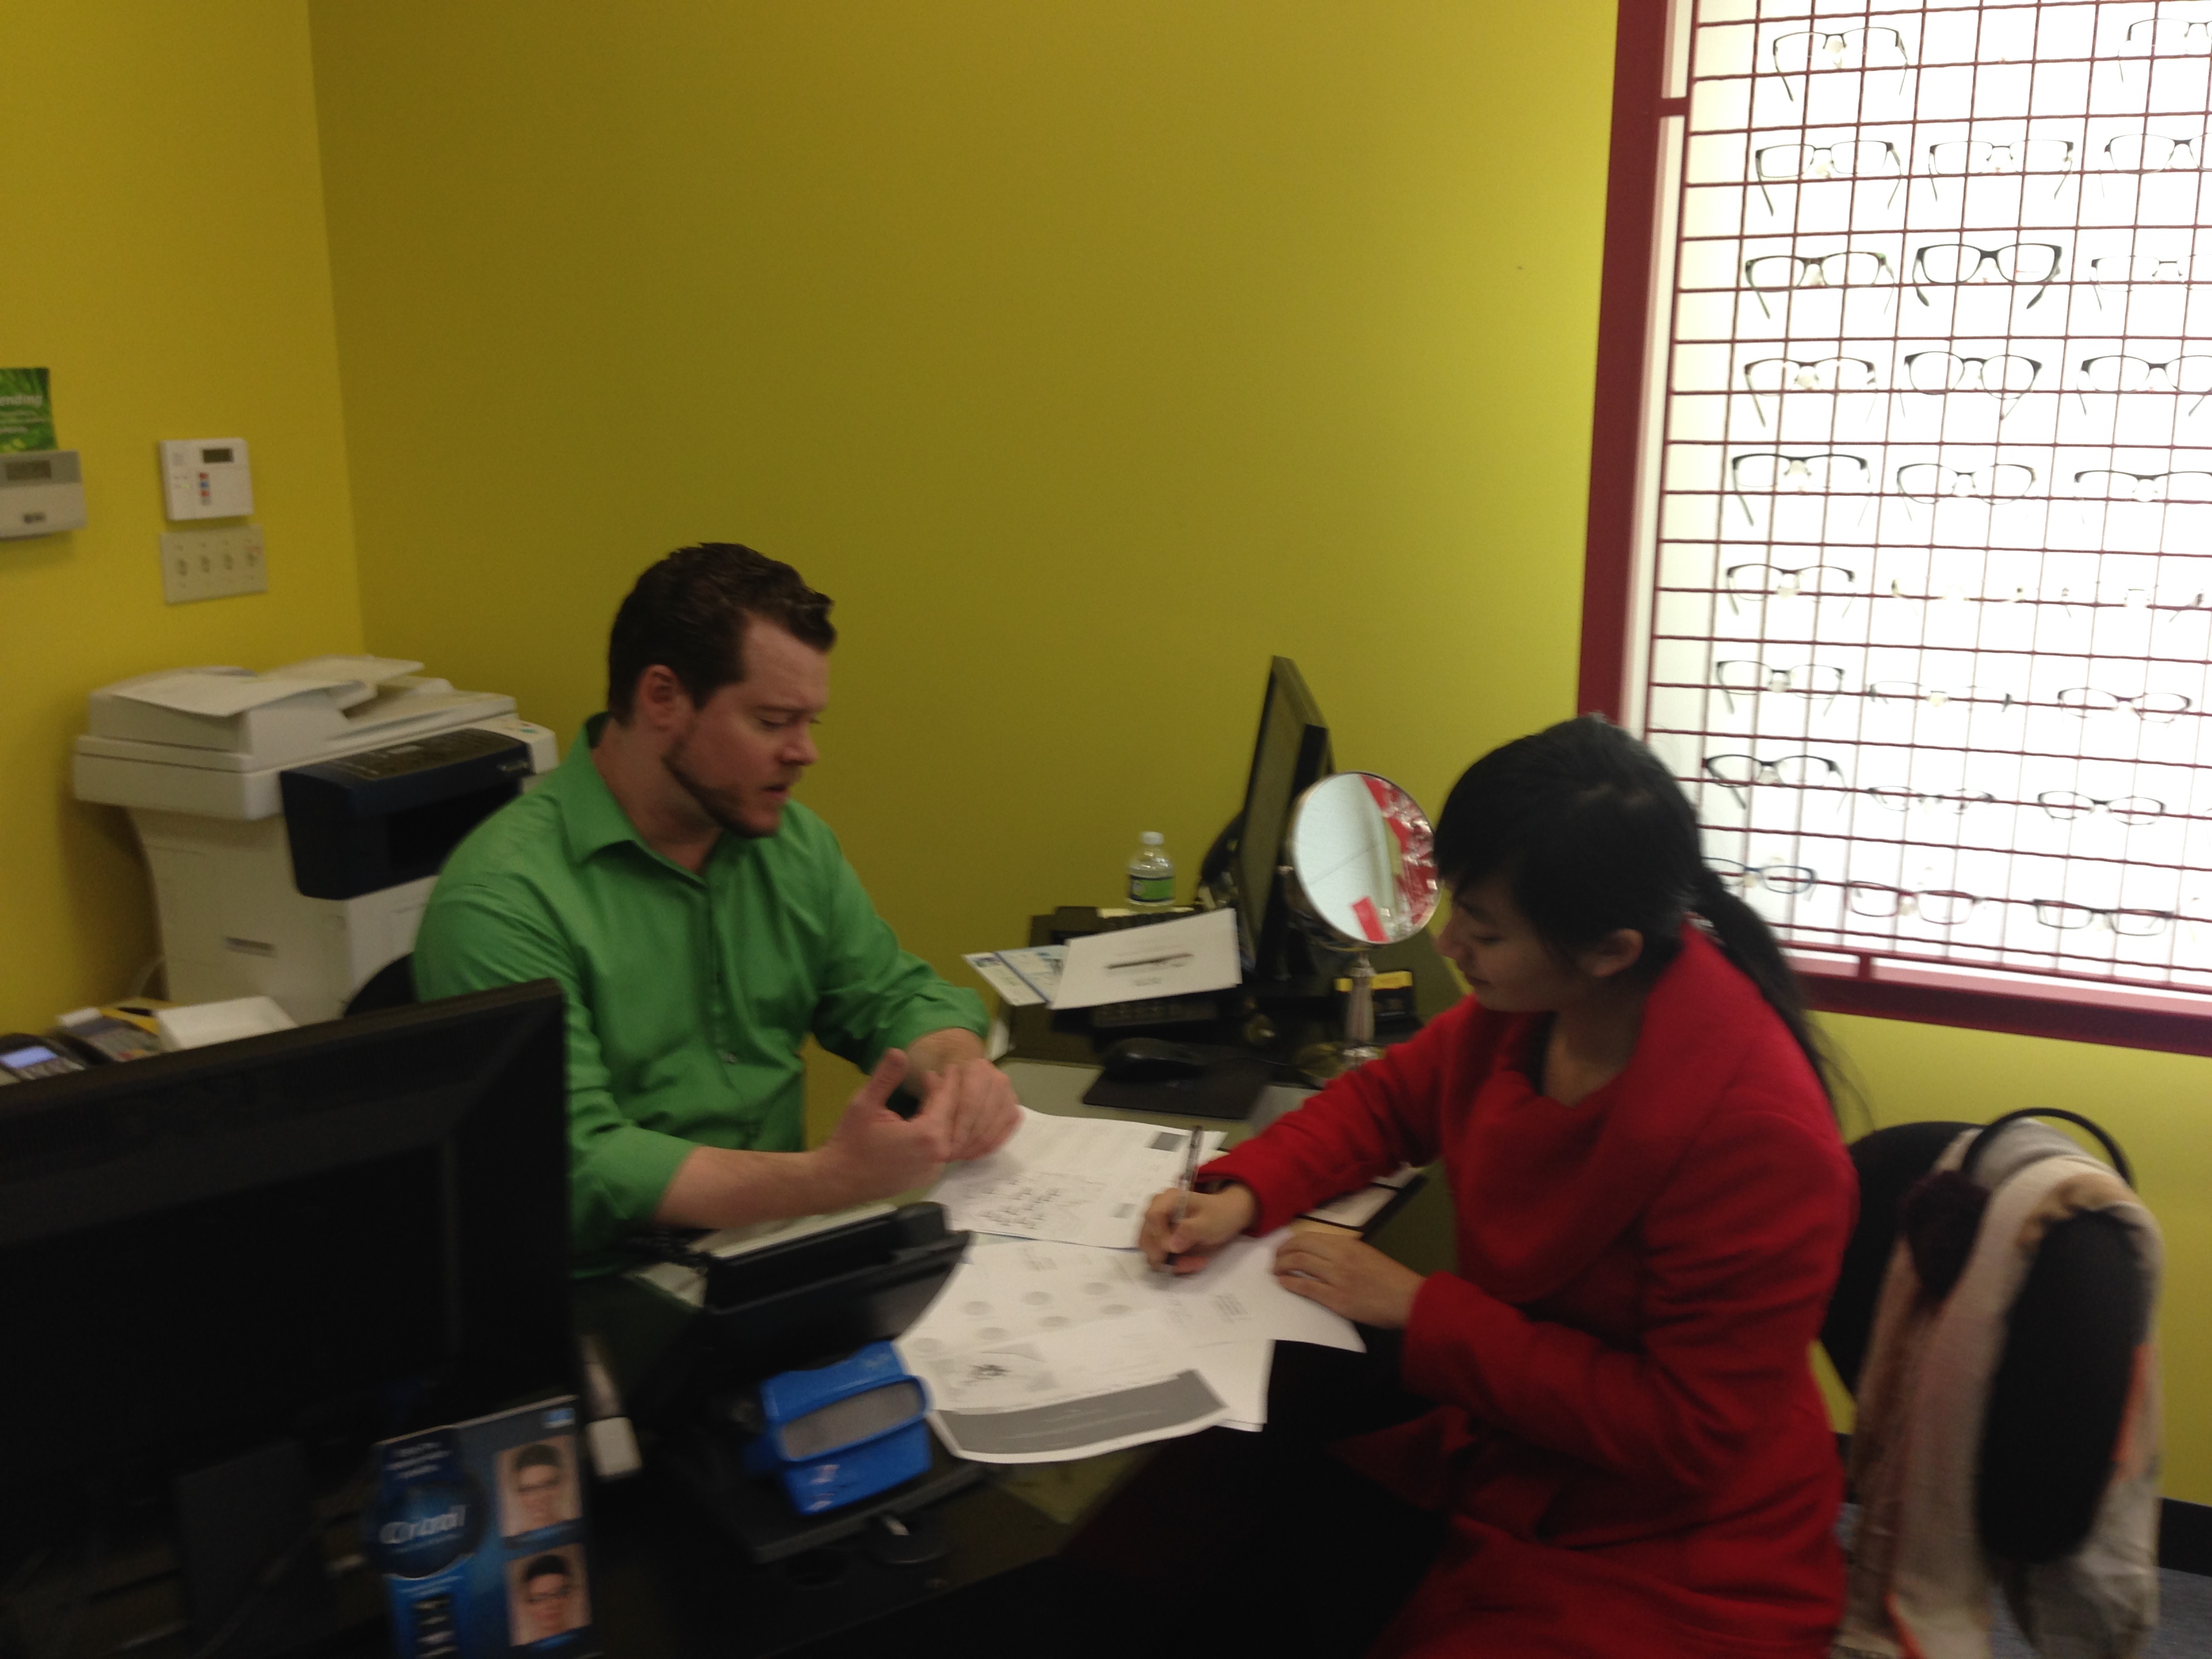
Talking with 11 potential users from 3 different industries (local restaurants and restaurants chains, optical service chains, members of the hospitality services), we found that prior to relocating or expanding a business,the business owner needs to know the demographics of the potential area, what properties are available, and detailed information about those properties. We grouped the considerations in finding a new business location into three key areas as follows:
- Demographics of the neighborhood
- Current business competition status
- Property value of the area

Vision of the solution
This application will allow restaurant owners to make an informed decision about where to begin their business expansion. With the application, restaurant owners will be able to target areas that will aid in the success and growth of their business.
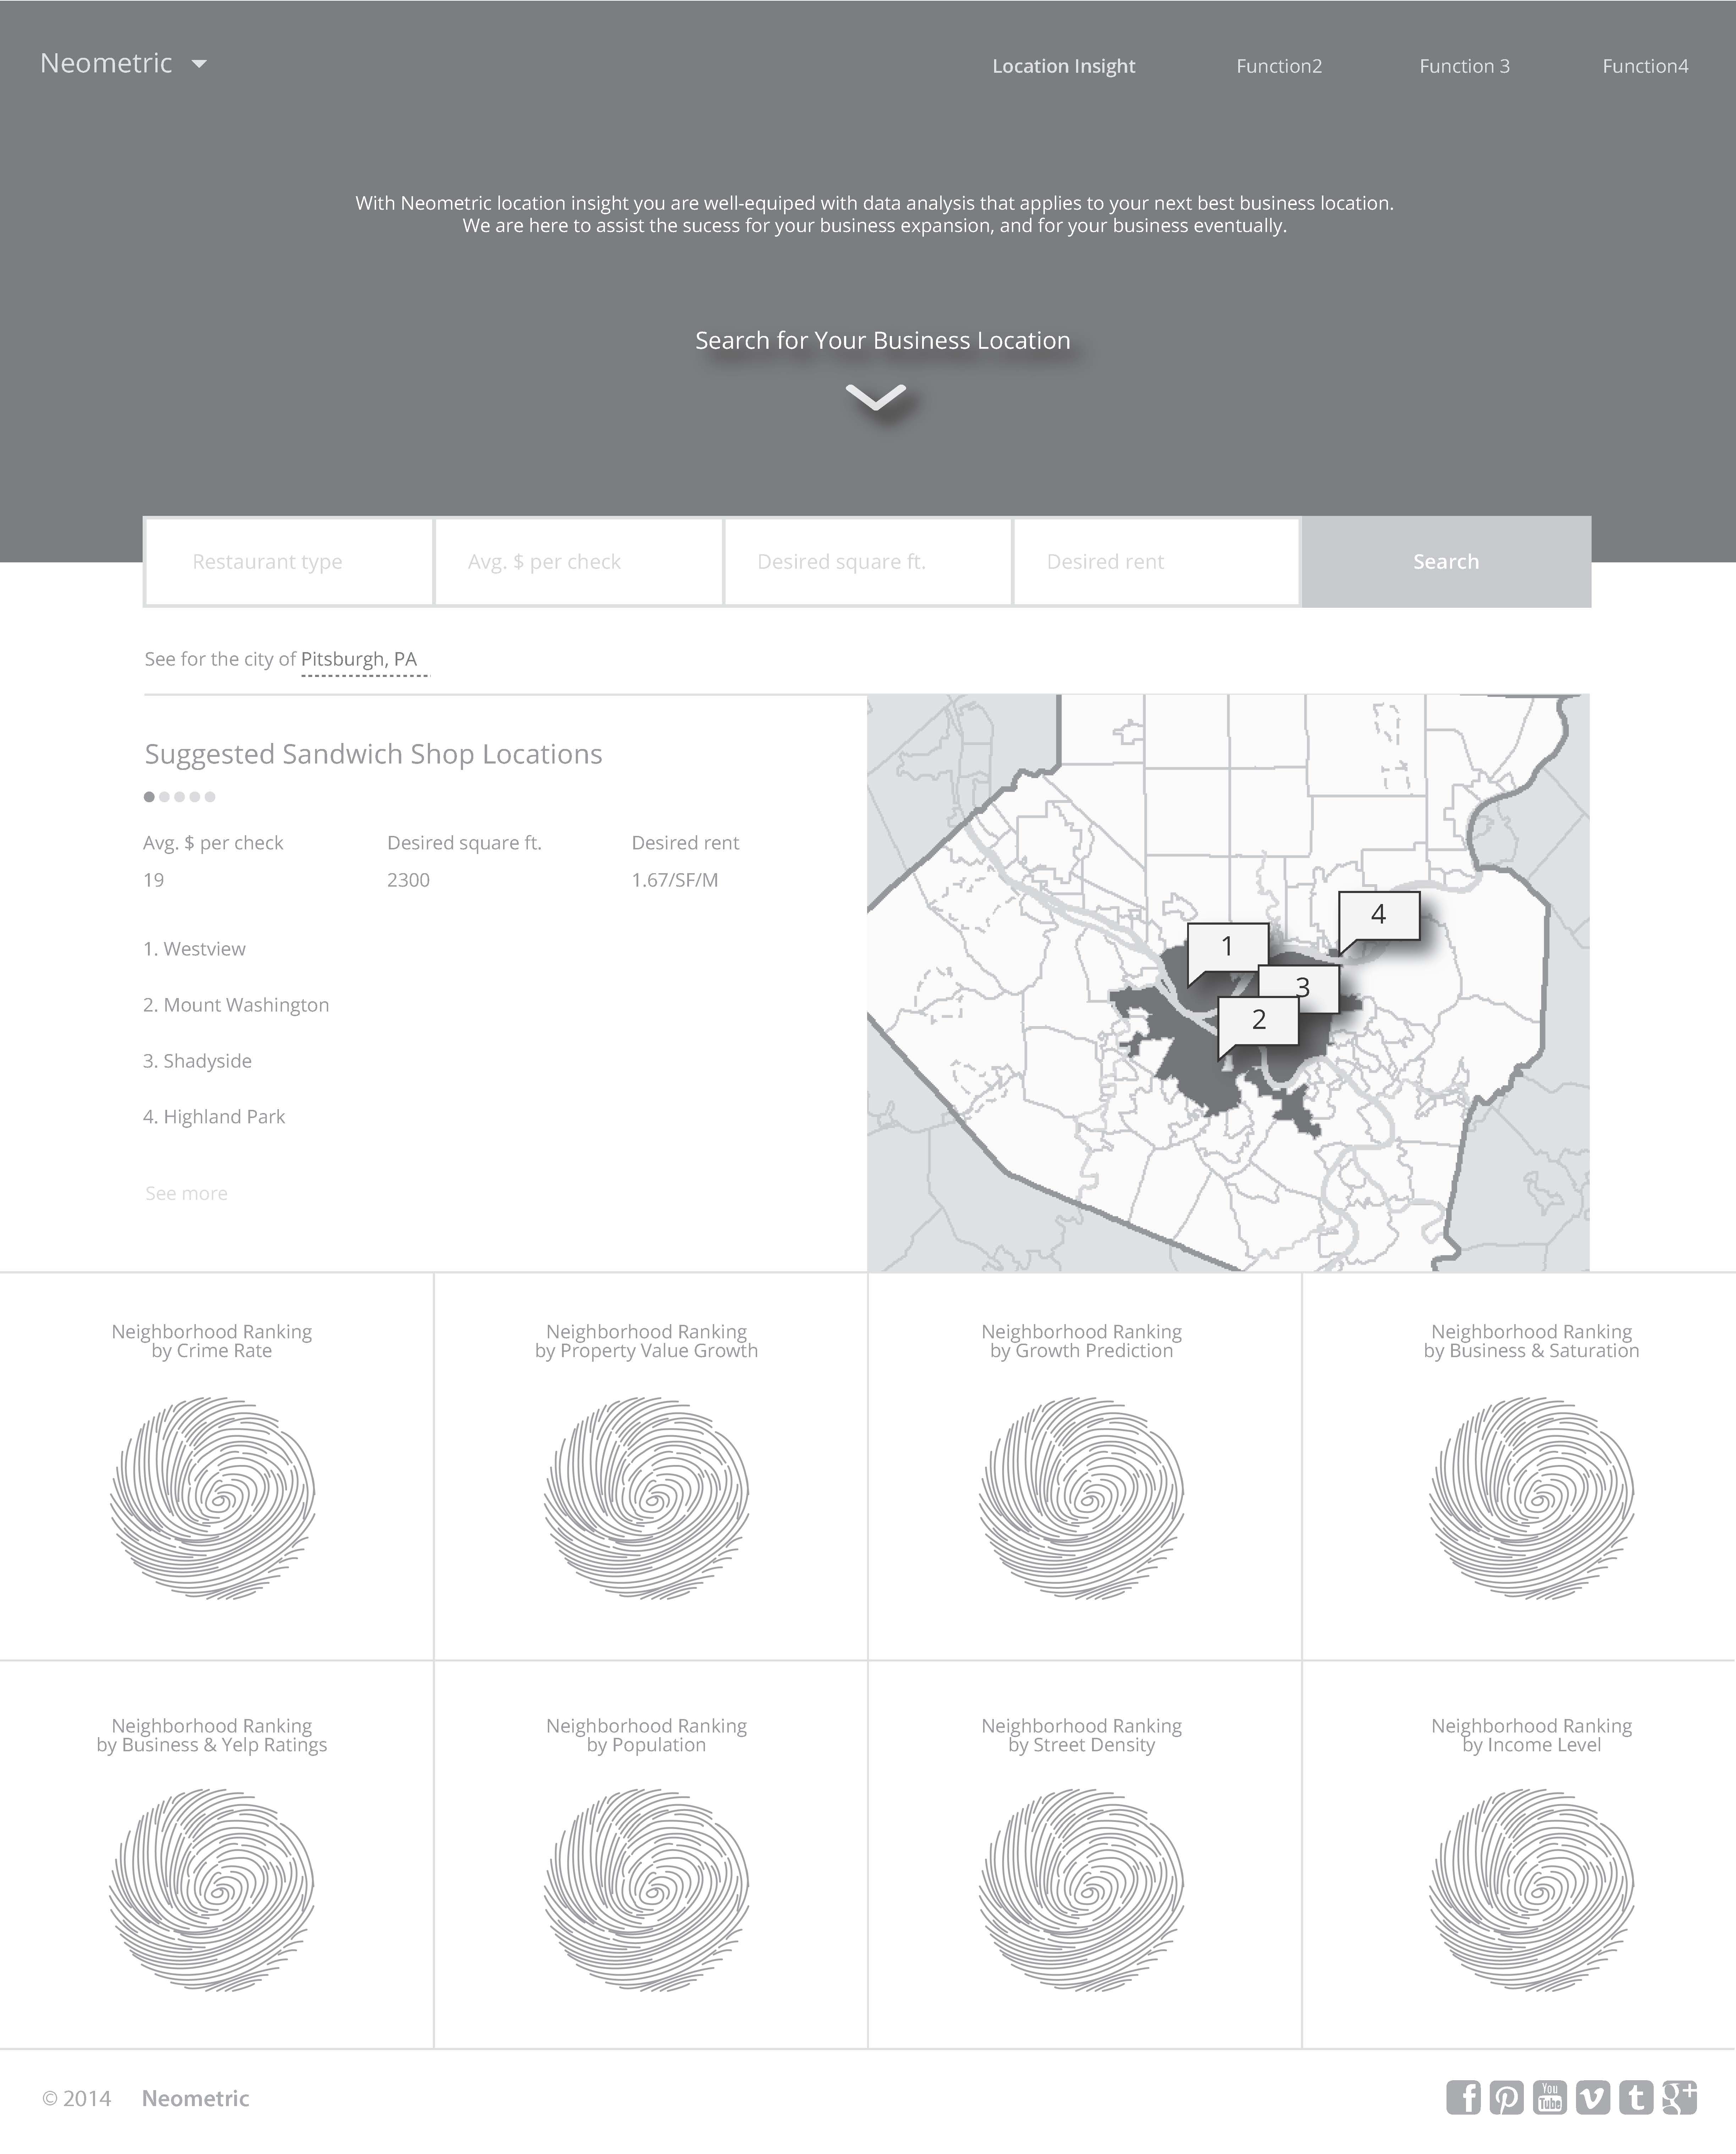
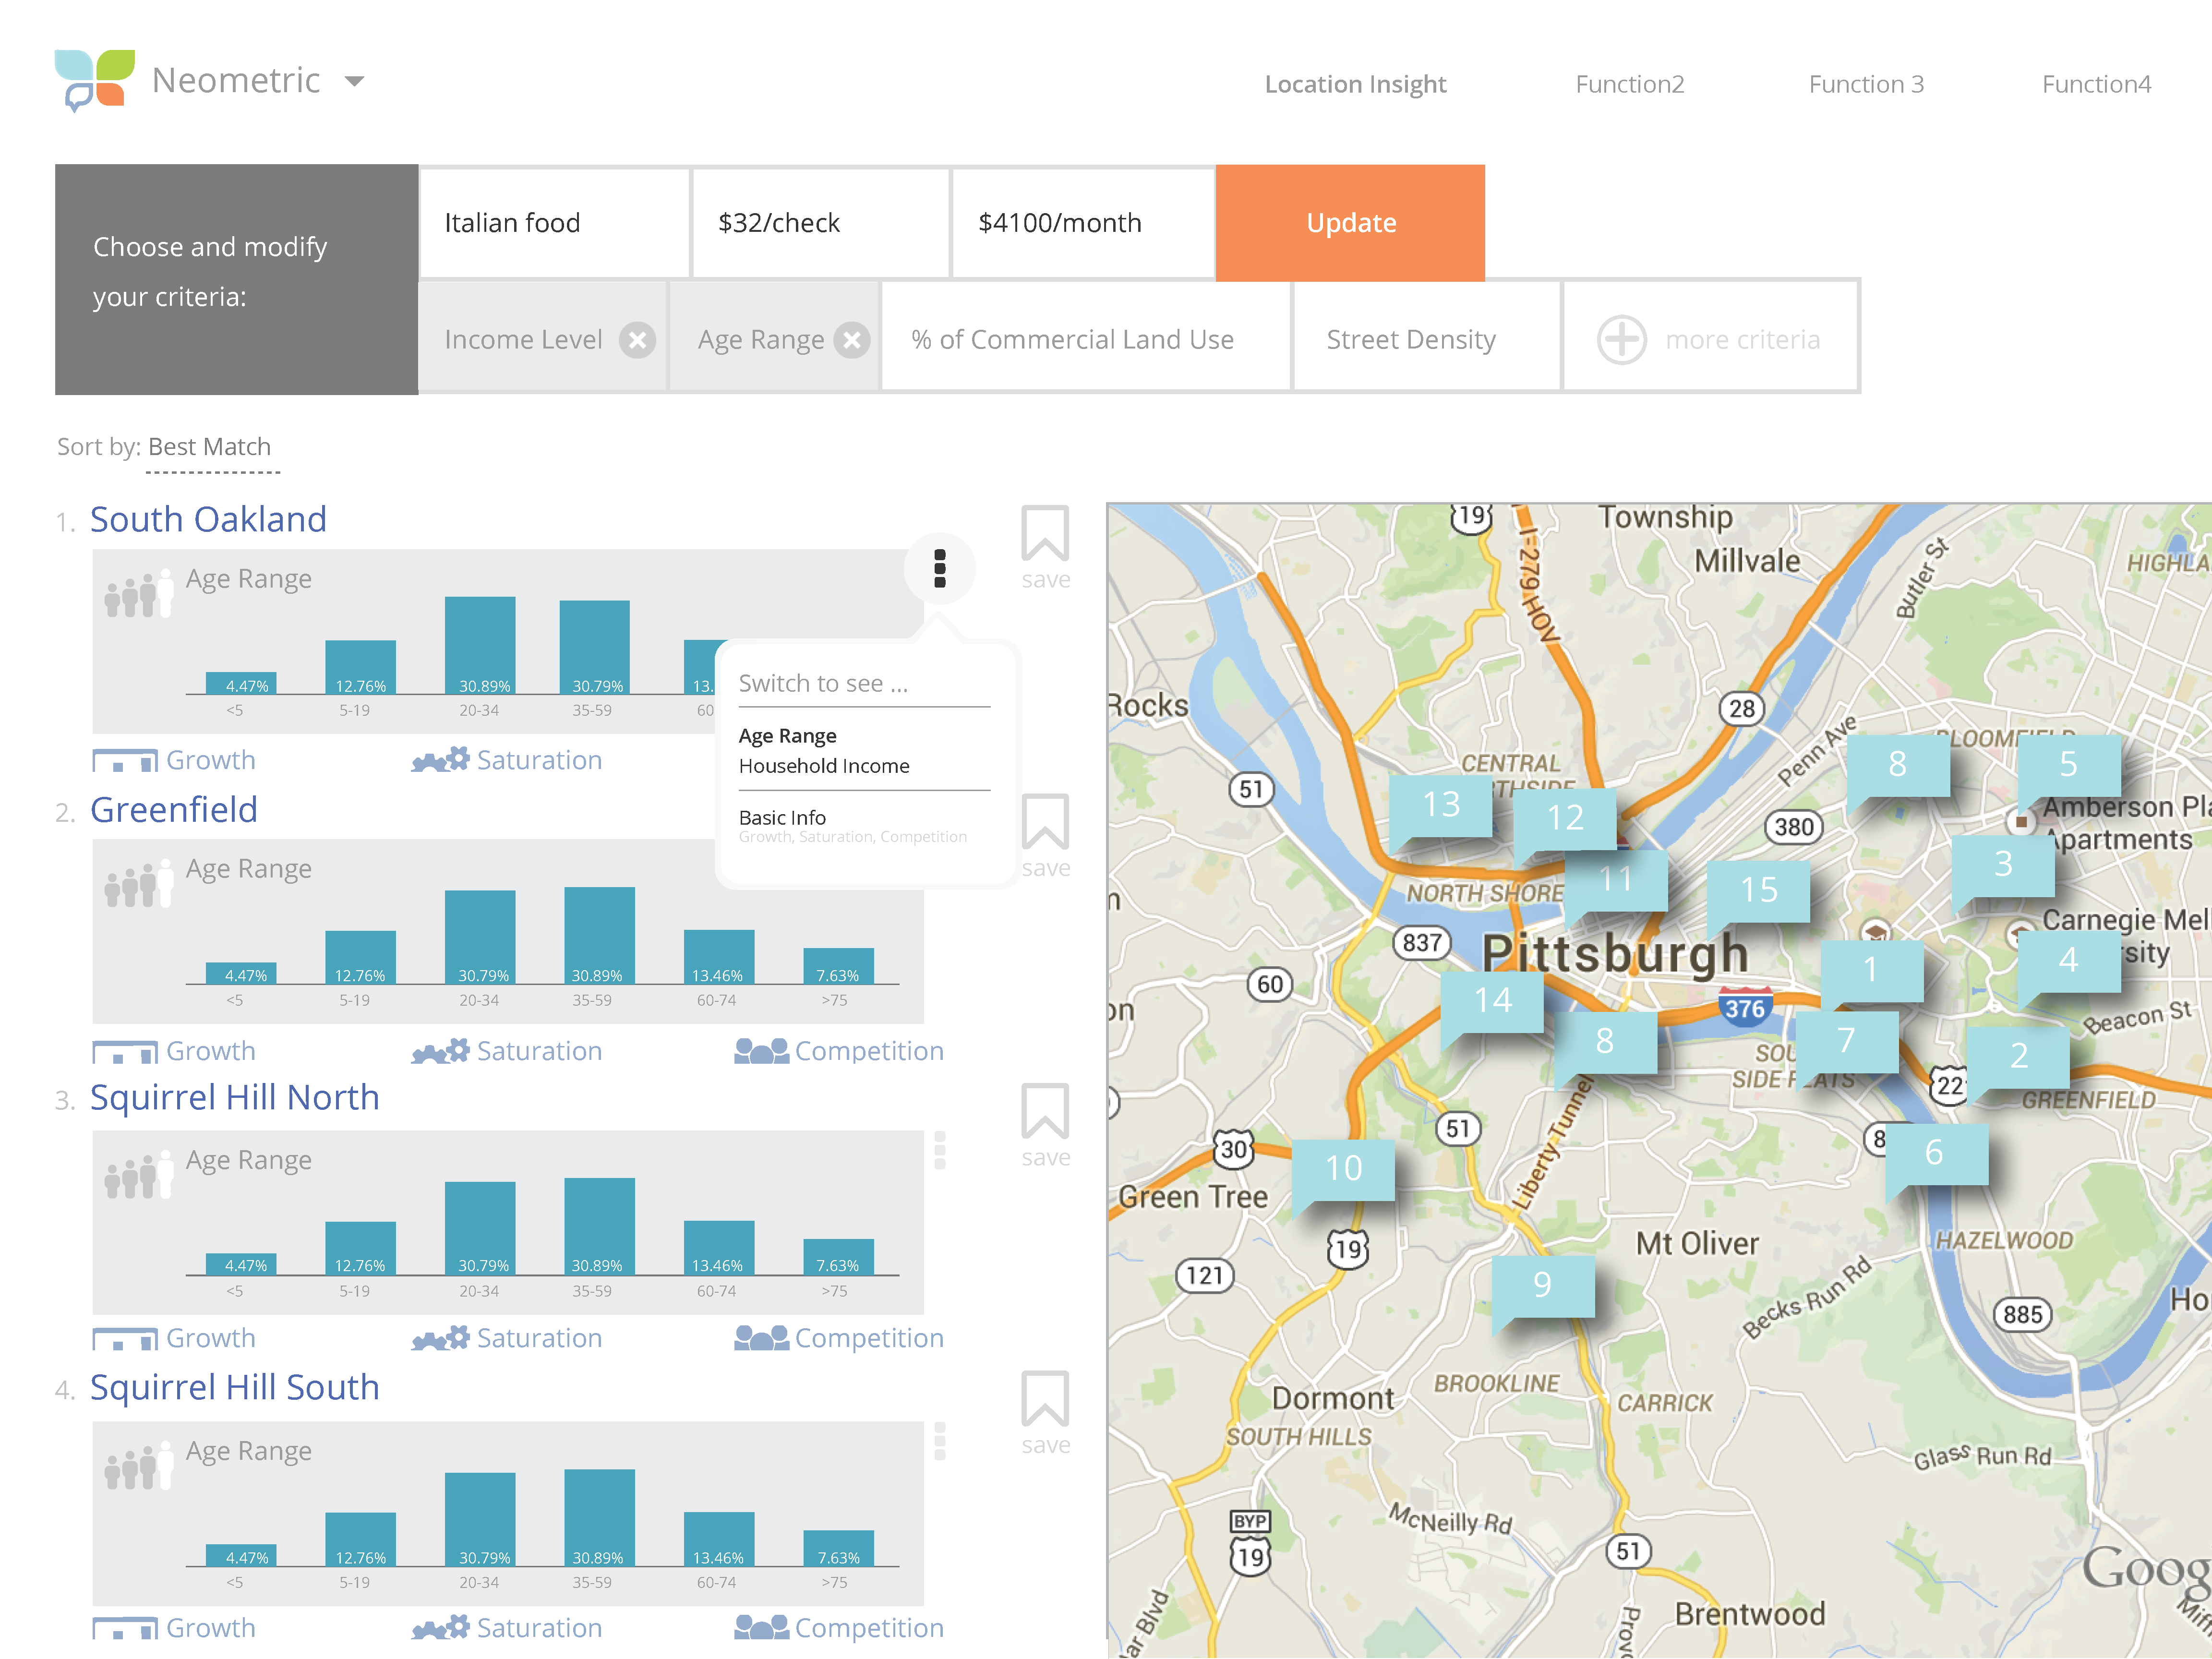
The vision of this iteration of the product is to create a web application that allows a user to search for a new location within Pittsburgh, providing:
- Restaurant “type” (limited to restaurant categories available from Yelp!, optional),
- $USD of target average checksize at new restaurant (required), and
- Maximum Monthly Rent (used to calculate the amount of sq. footage they can afford in a given neighborhood).

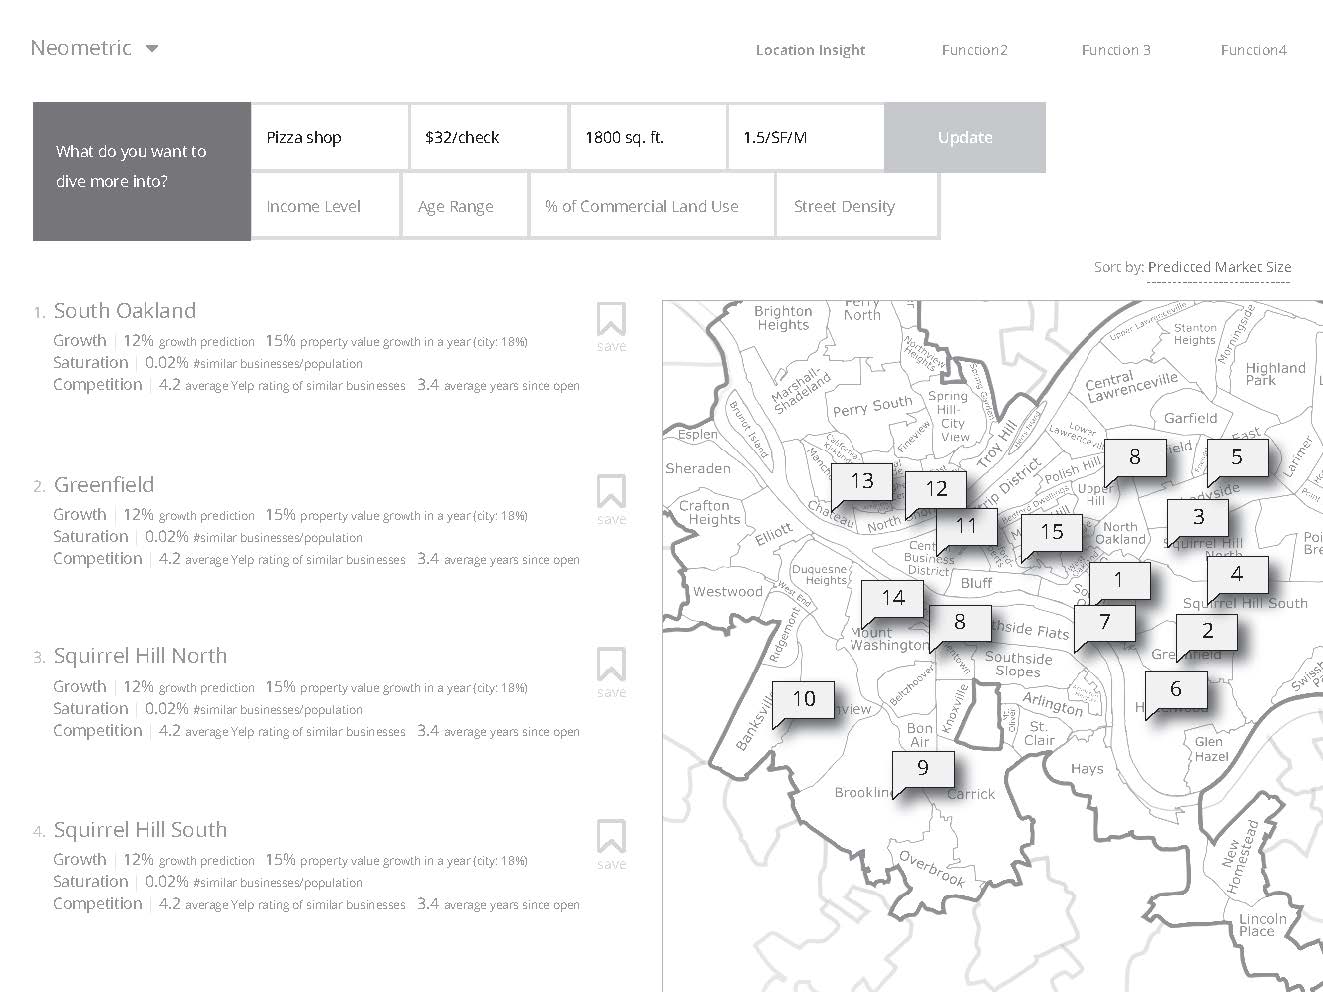
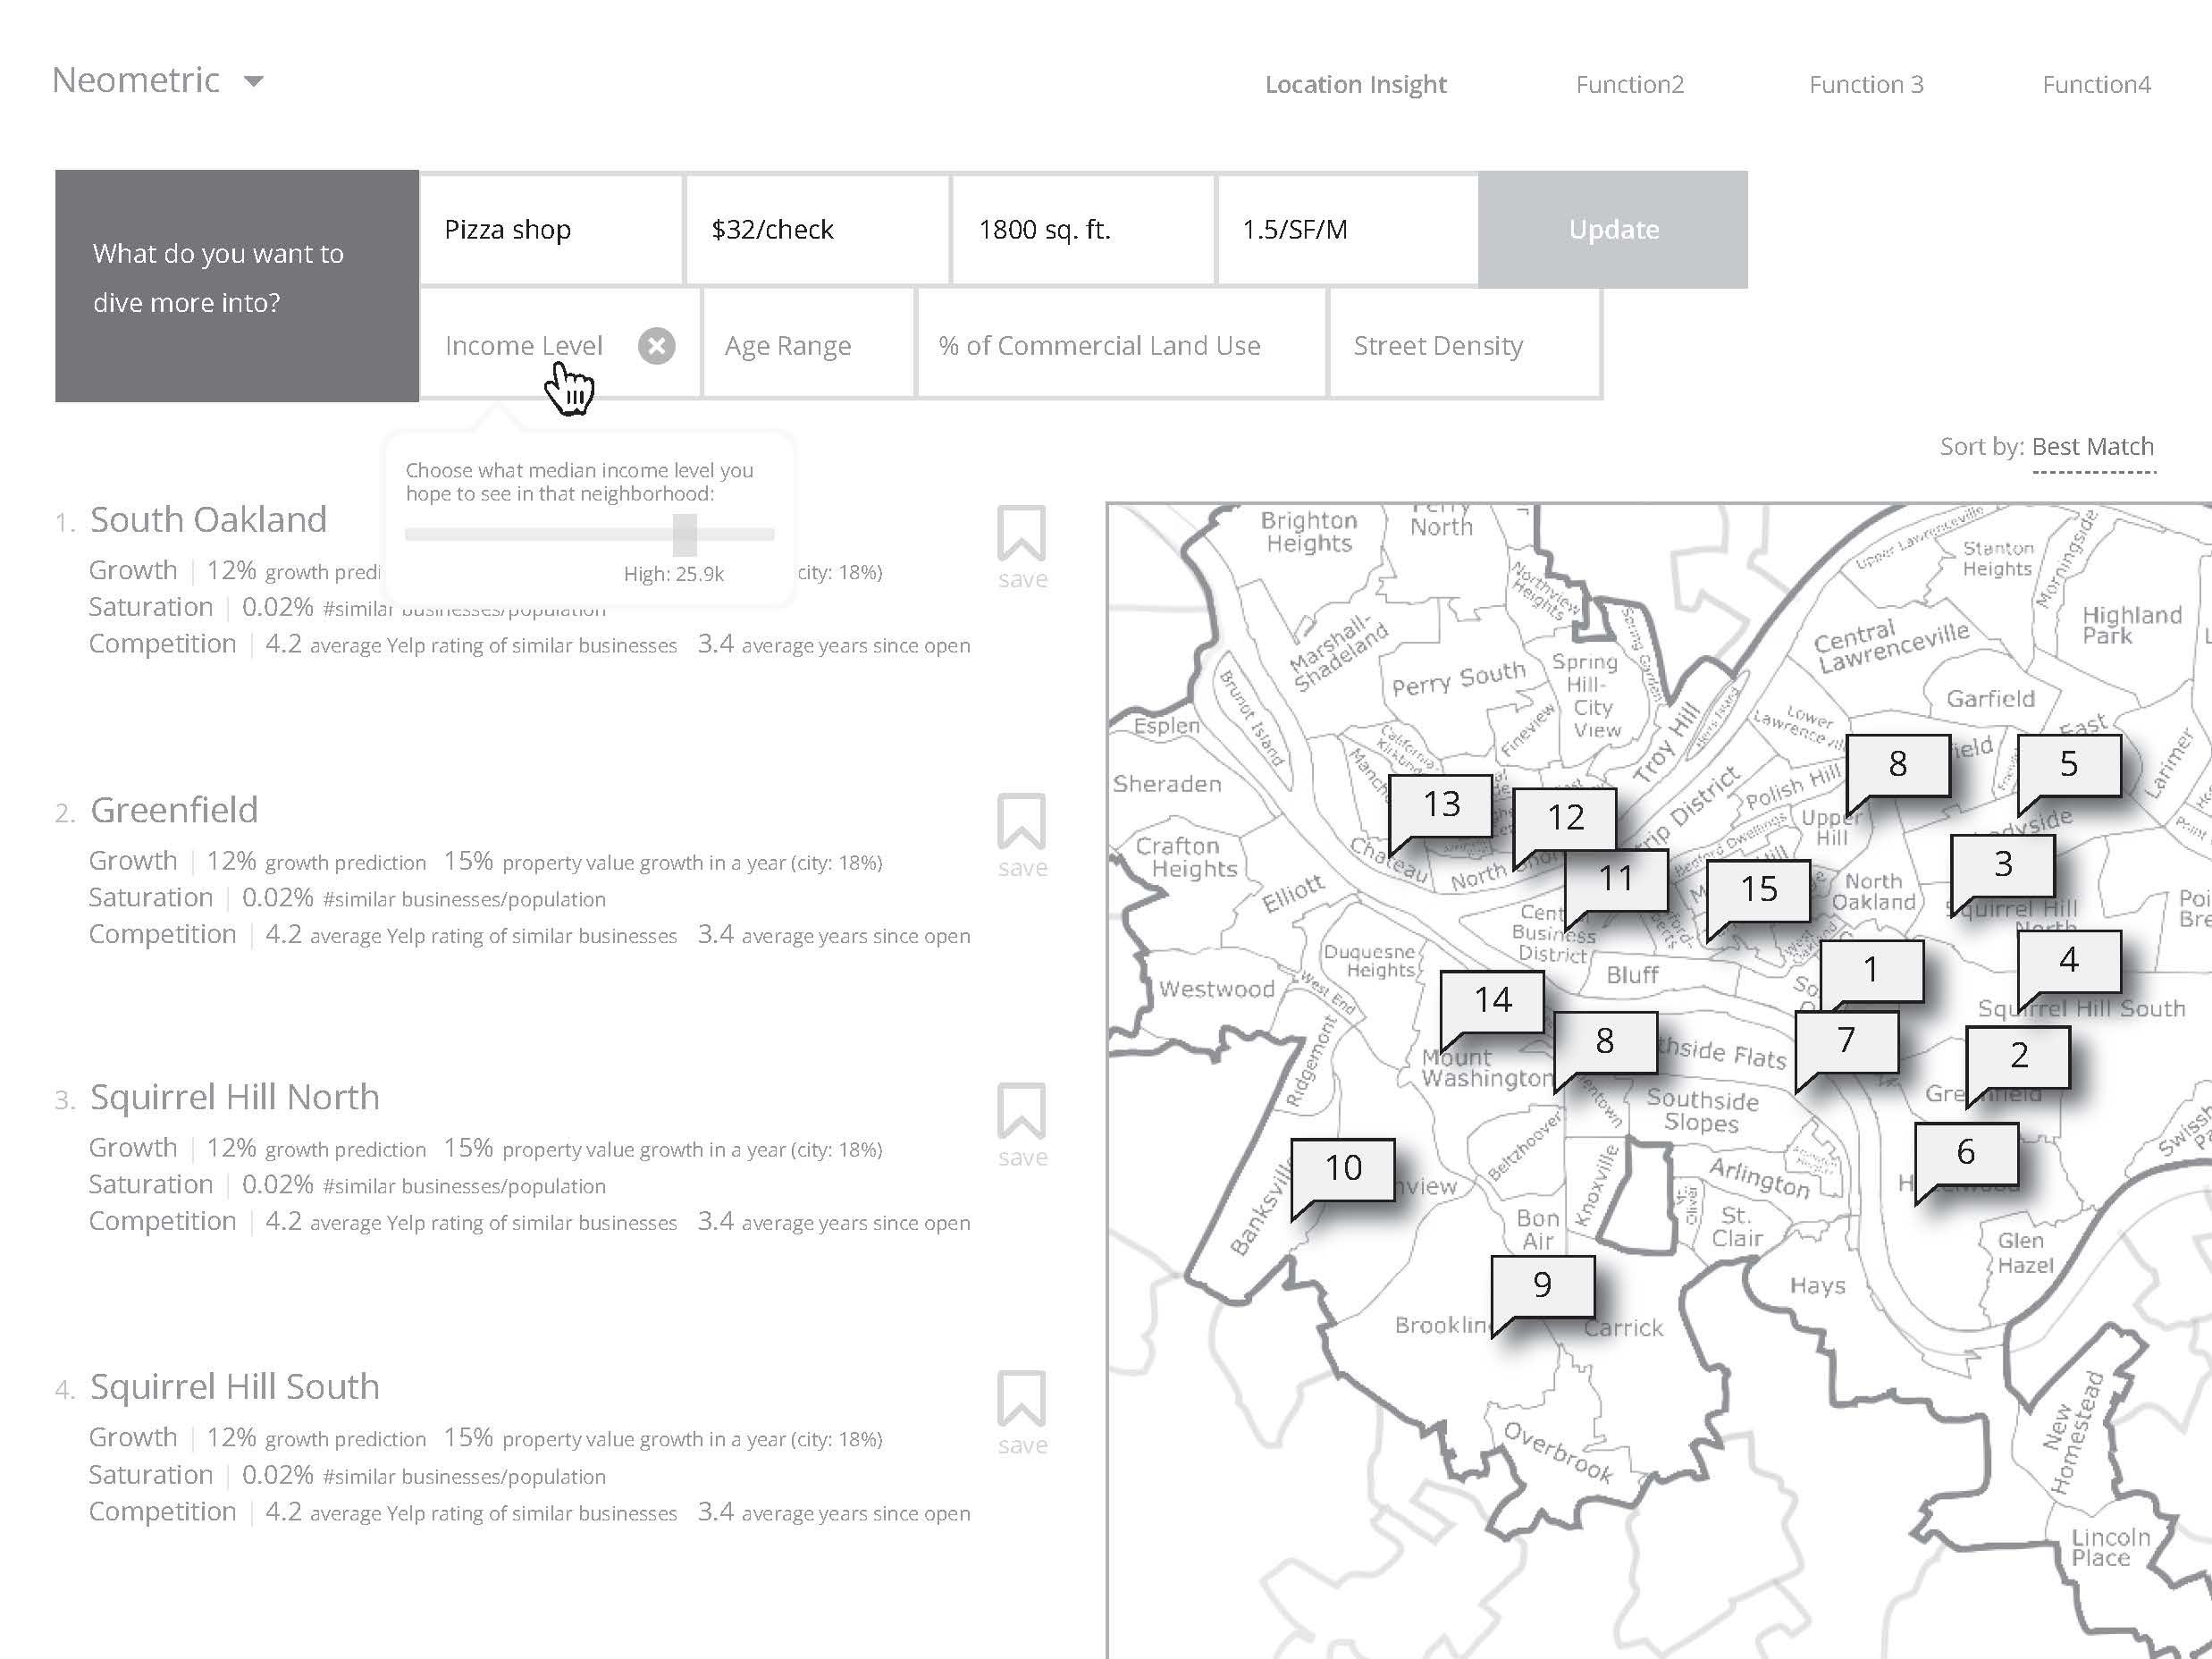
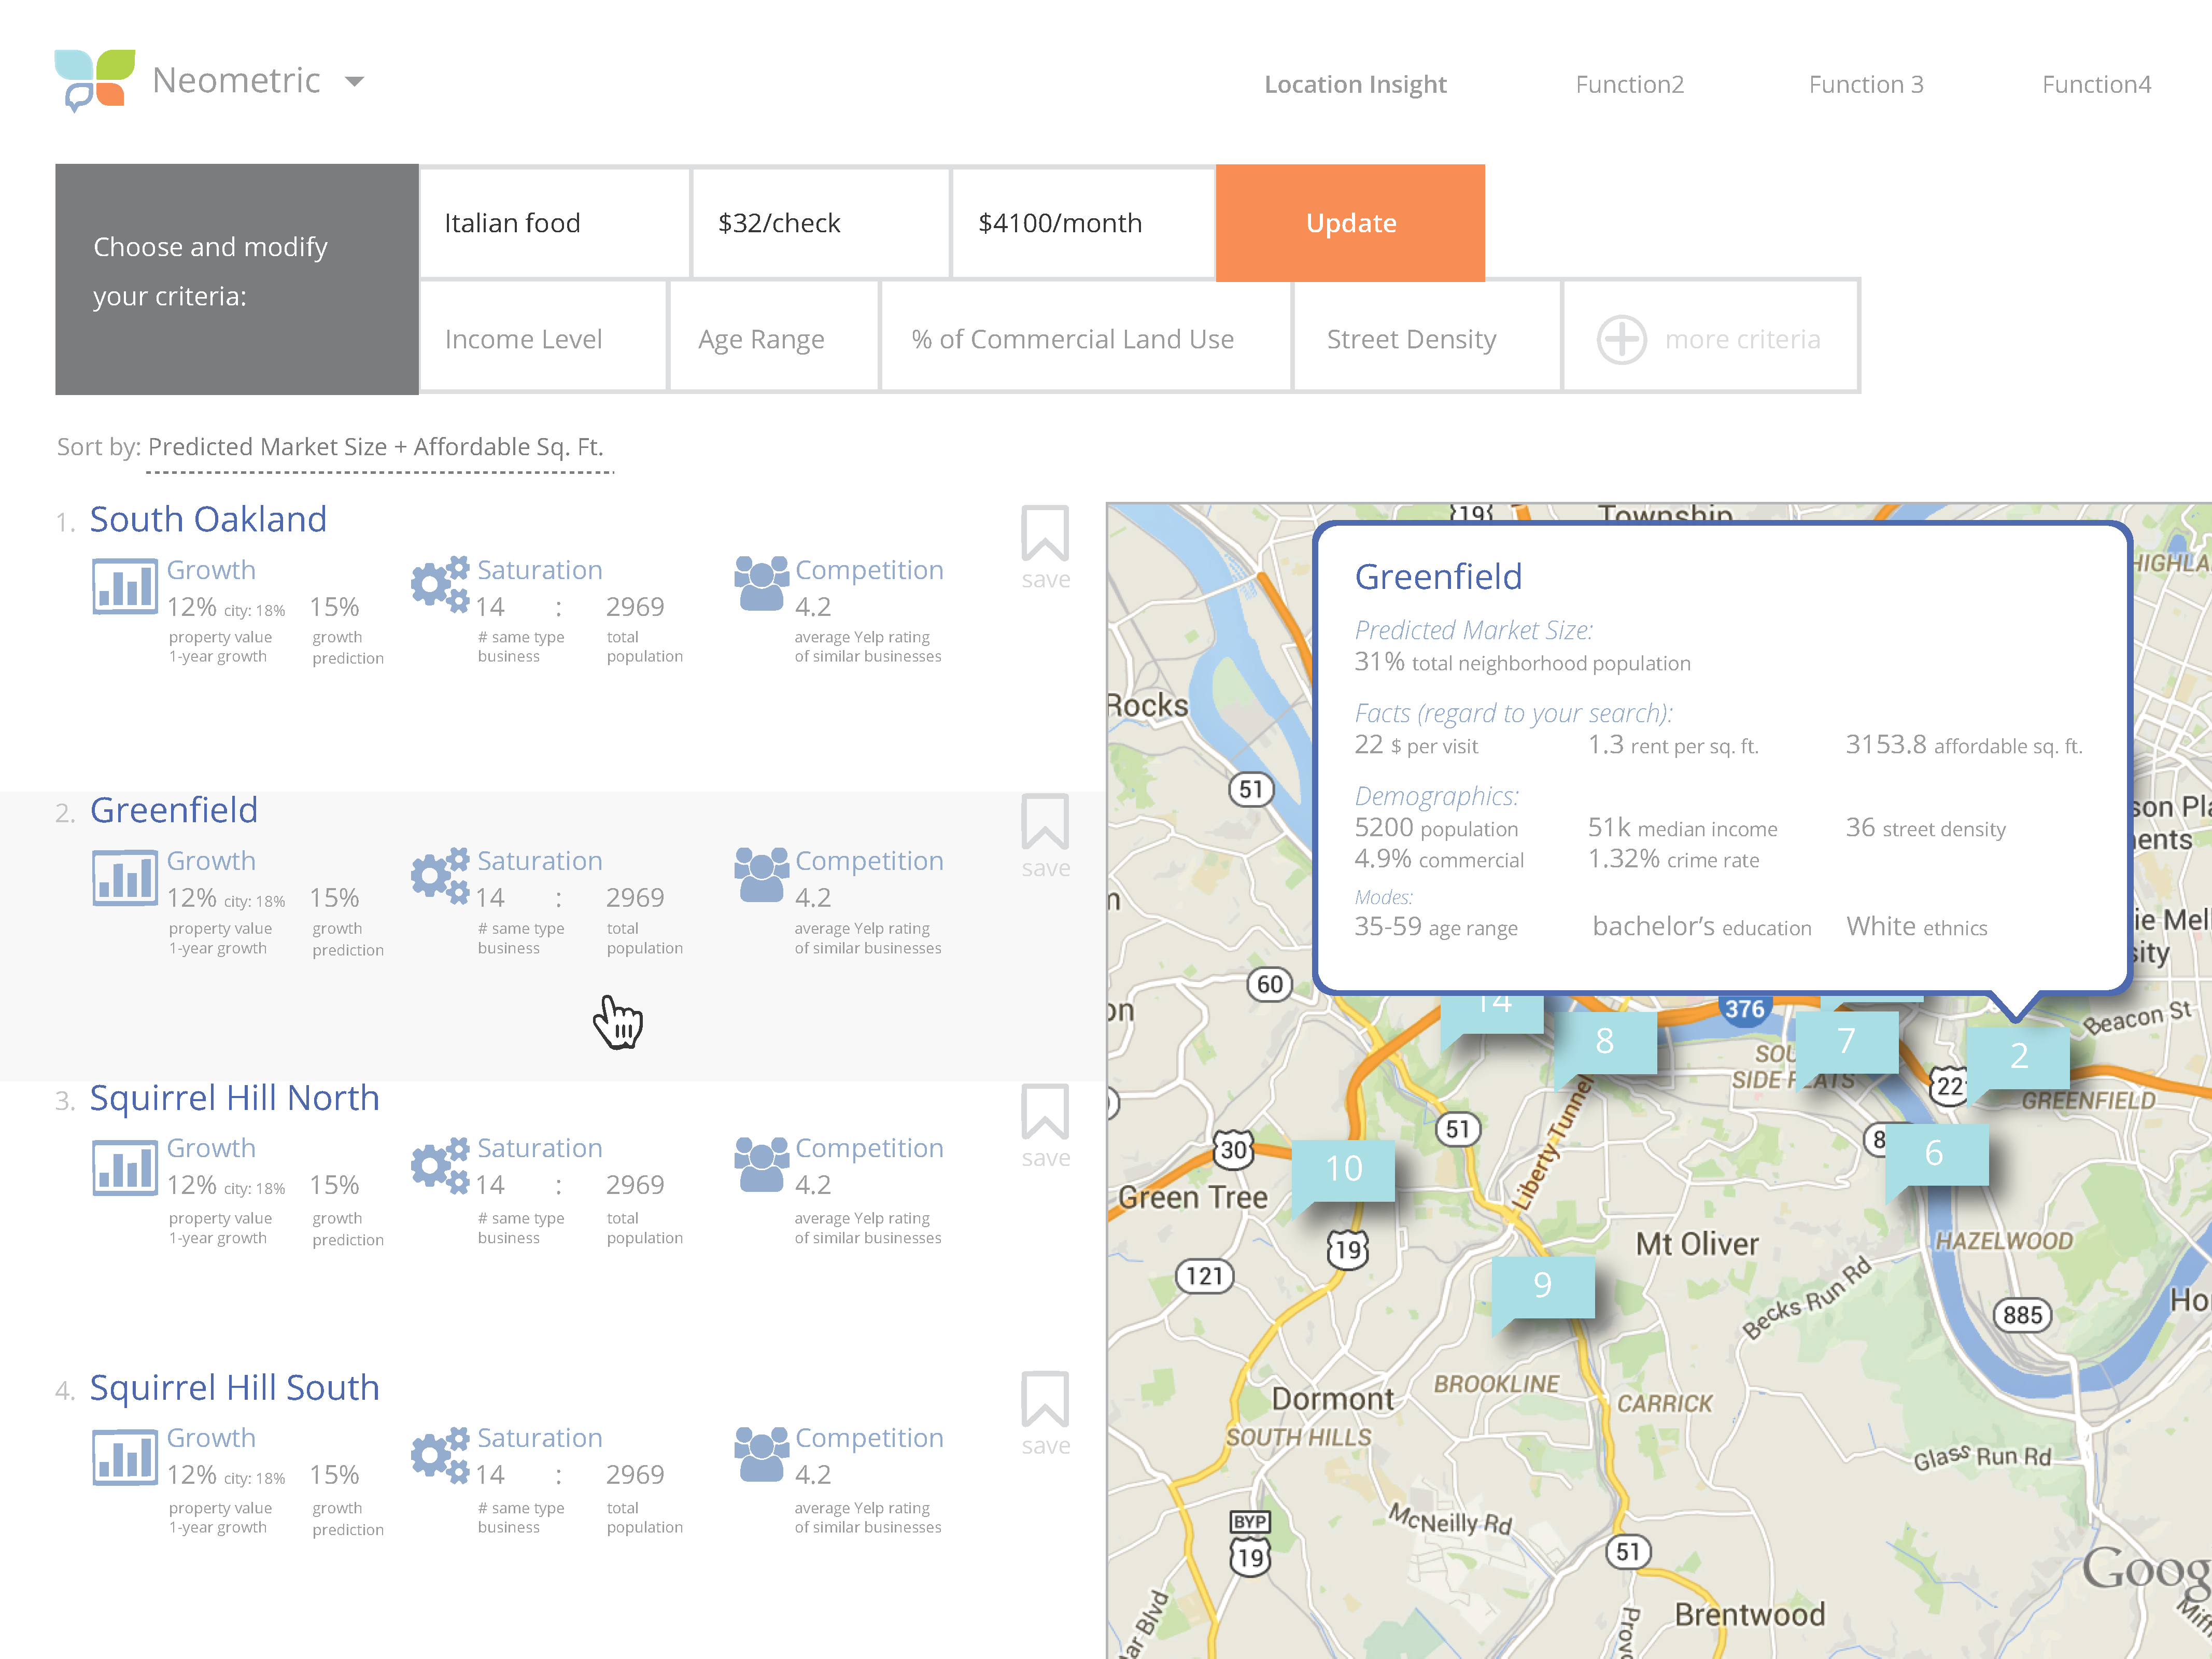
Using the $USD checksize, the web application will approximate a predicted market size (PMS) based on the Household Income Distribution (HHI) in each neighborhood, and use this information to predict potential relocation areas that will be ranked according to their probability for success.
Personas

Wireframes
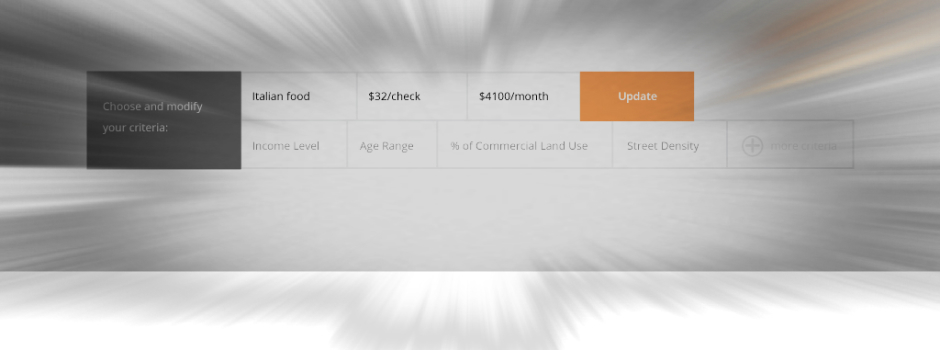
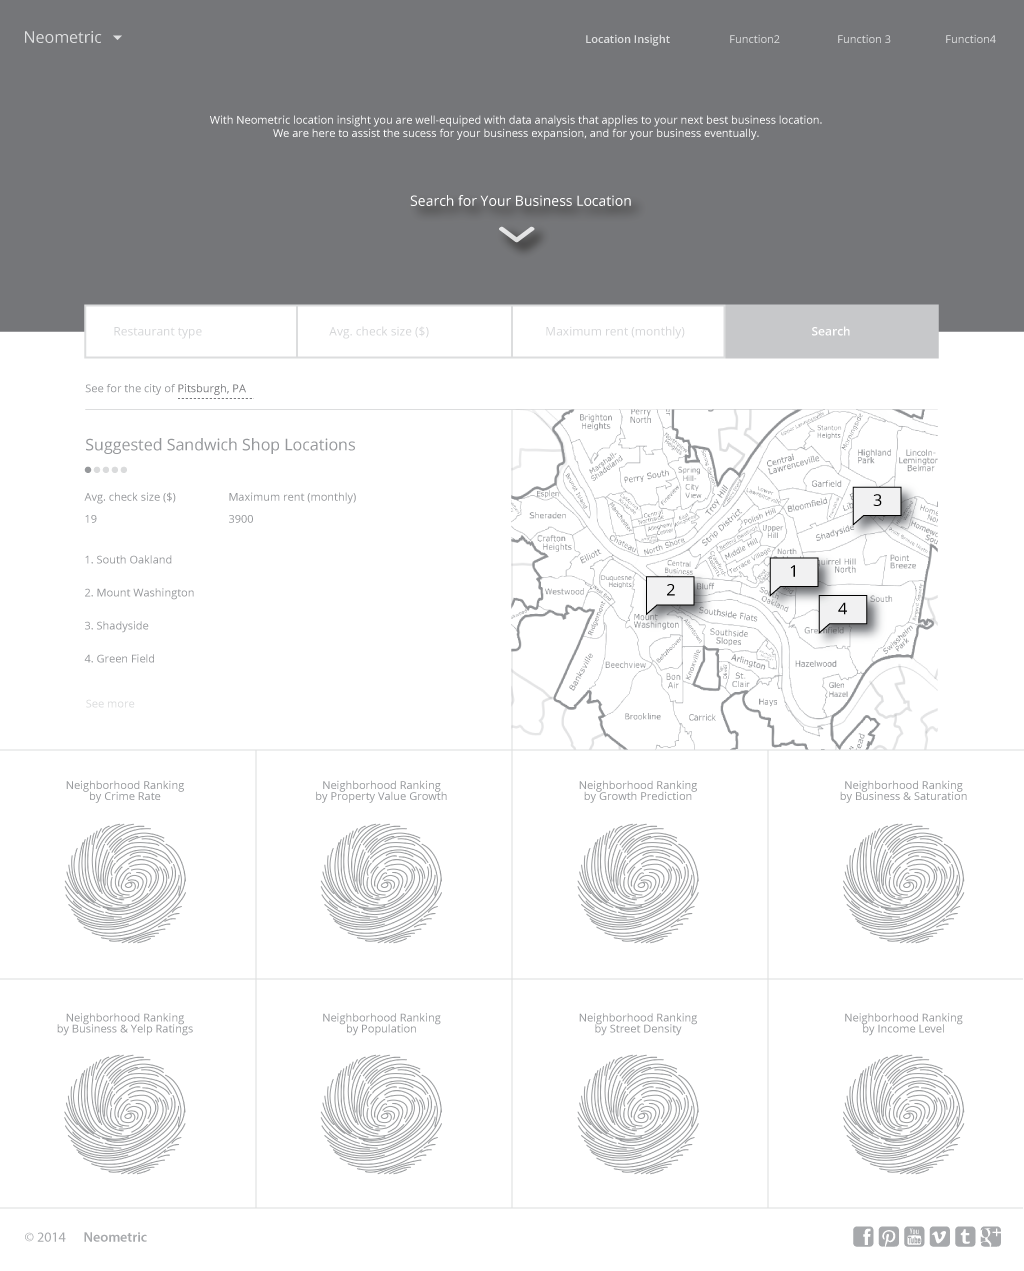
I started the wireframing process to illustrate several key scenarios from search landing, adjusting, to detail pages. And I presented the initial wireframes to key stakeholders at Neometric Inc.
Usability test
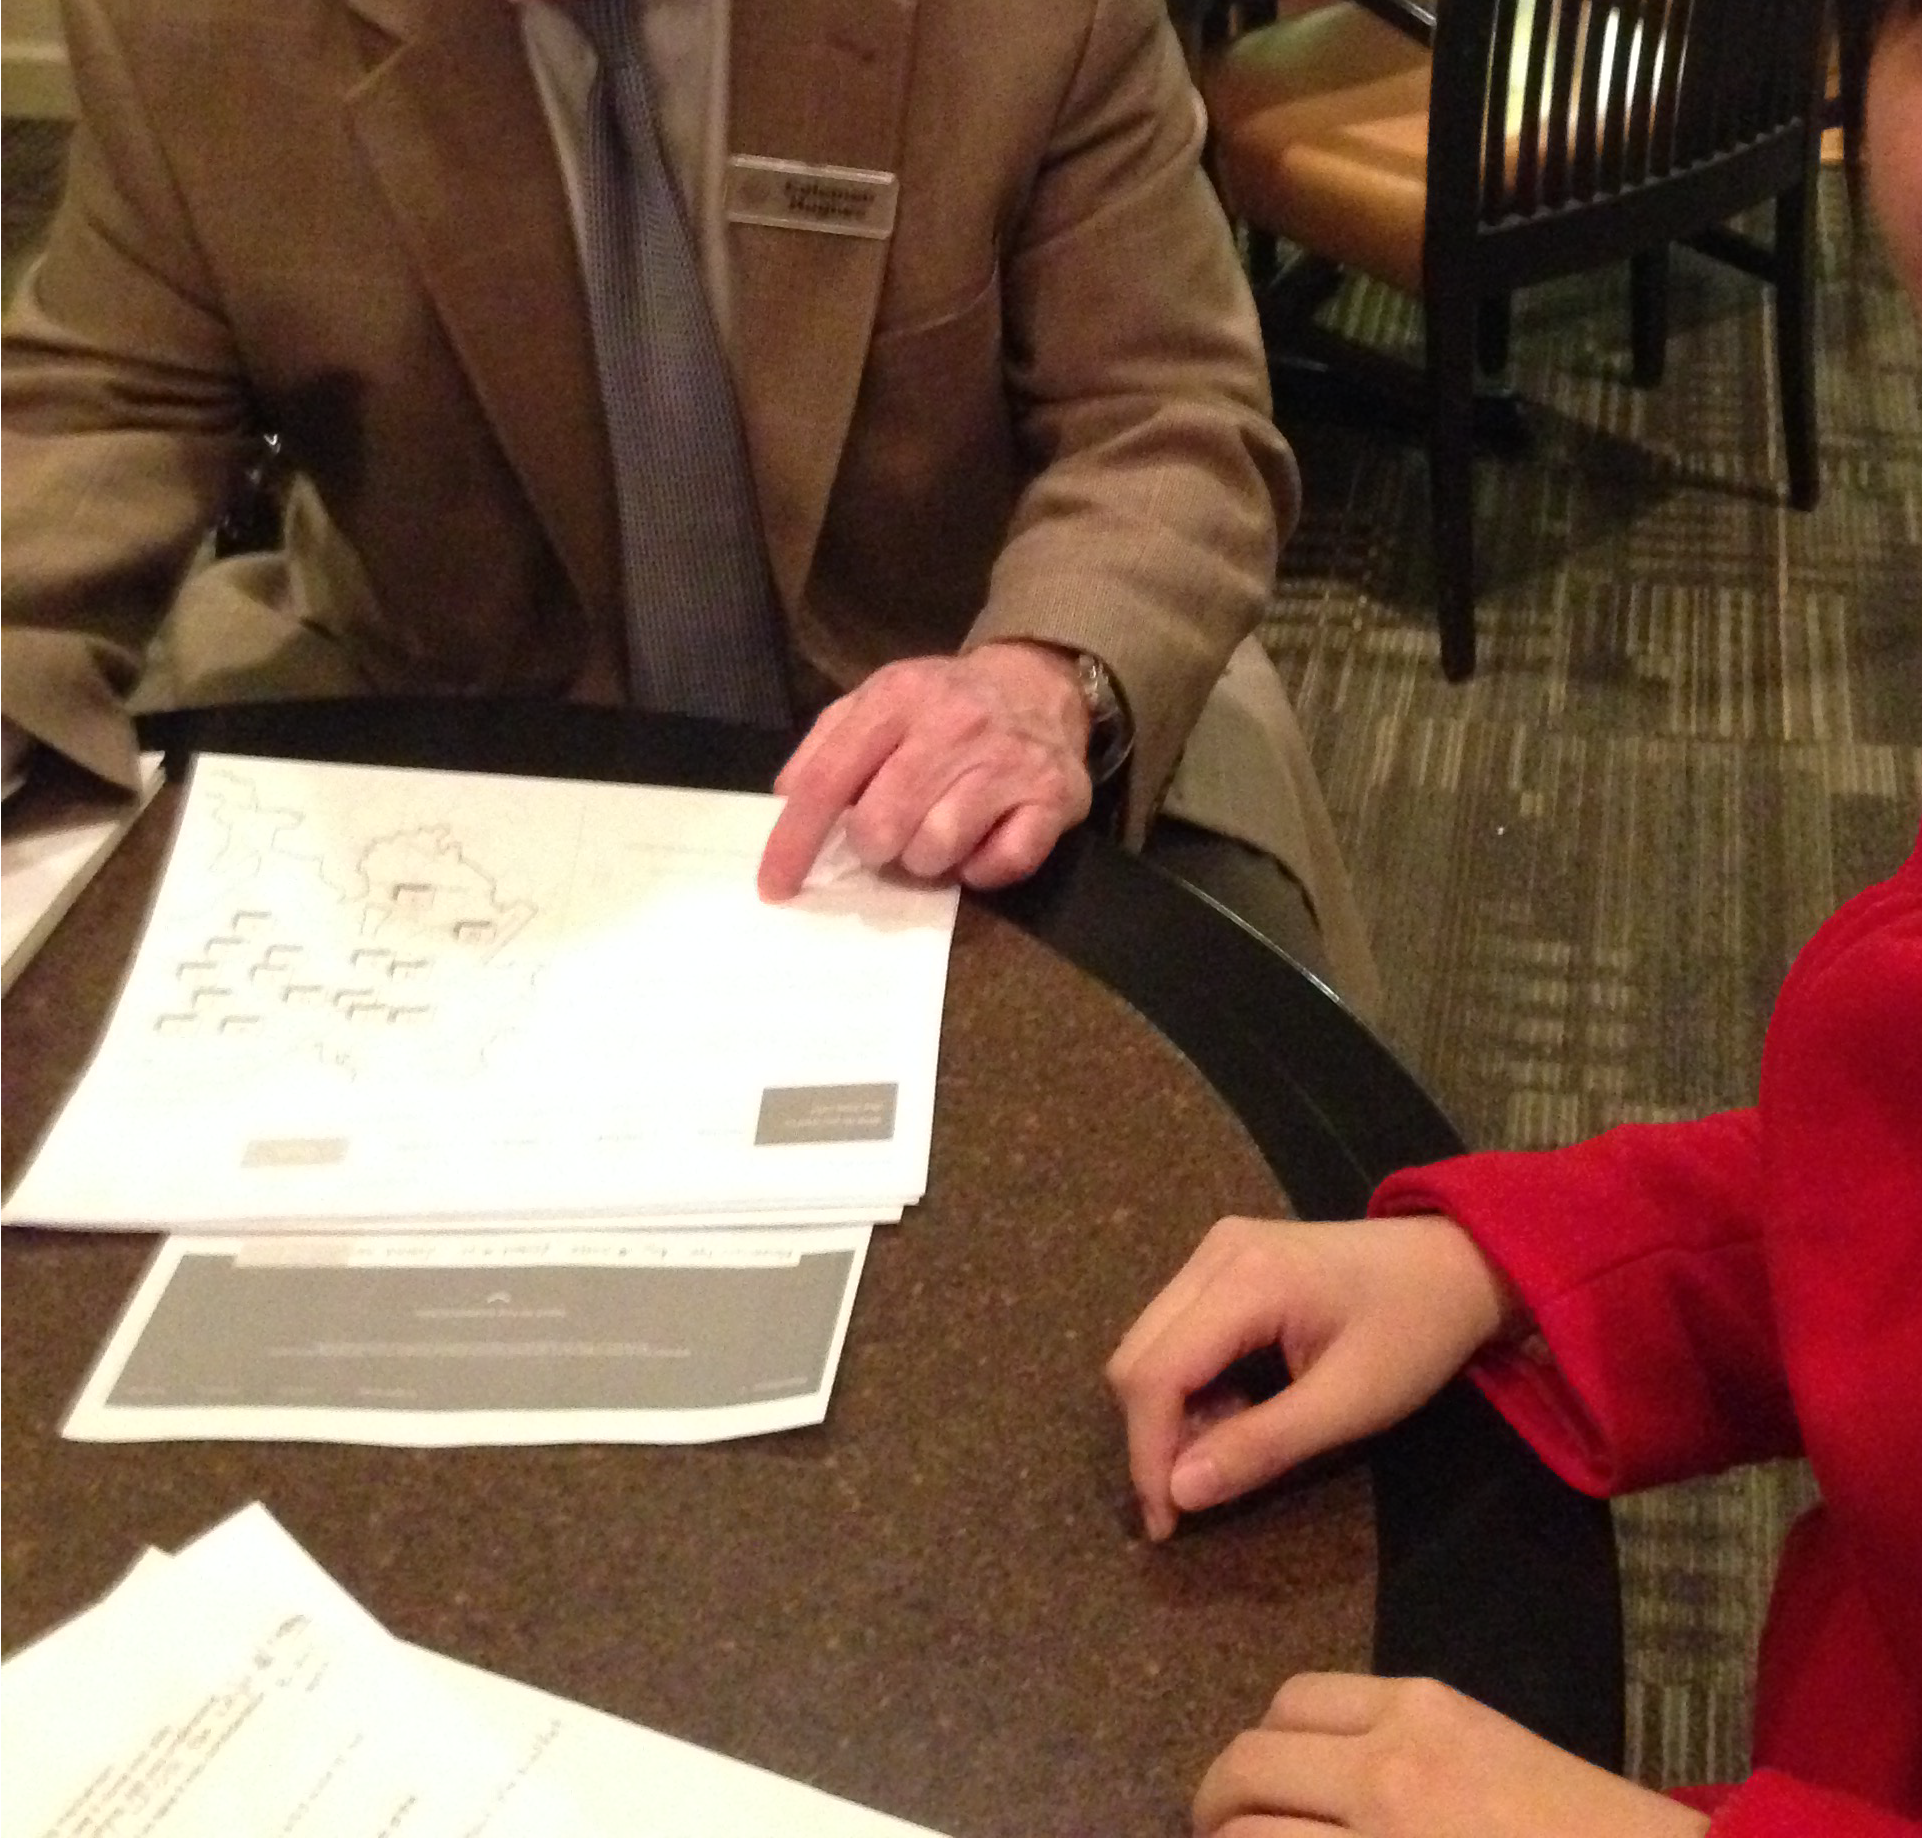
Putting the printed wireframes in front of 2 real users’ faces, we performed think-aloud protocol in the usability tests. Each test is 40-min long, and users are asked to perform tasks I designed to understand user perceptions on the product navigation, ease of use, cognitive focus levels, and how well their needs are taken care of with regard to the product functionality.
Iteration
Based on summarized findings from usability test with respect to customer benefits and insights, I applied changes to the wireframes, and converted them to higher fidelity designs.


Experience map

Final design
Click on the pictures below to step through all designs. (Presented using Axure RP 7.0)
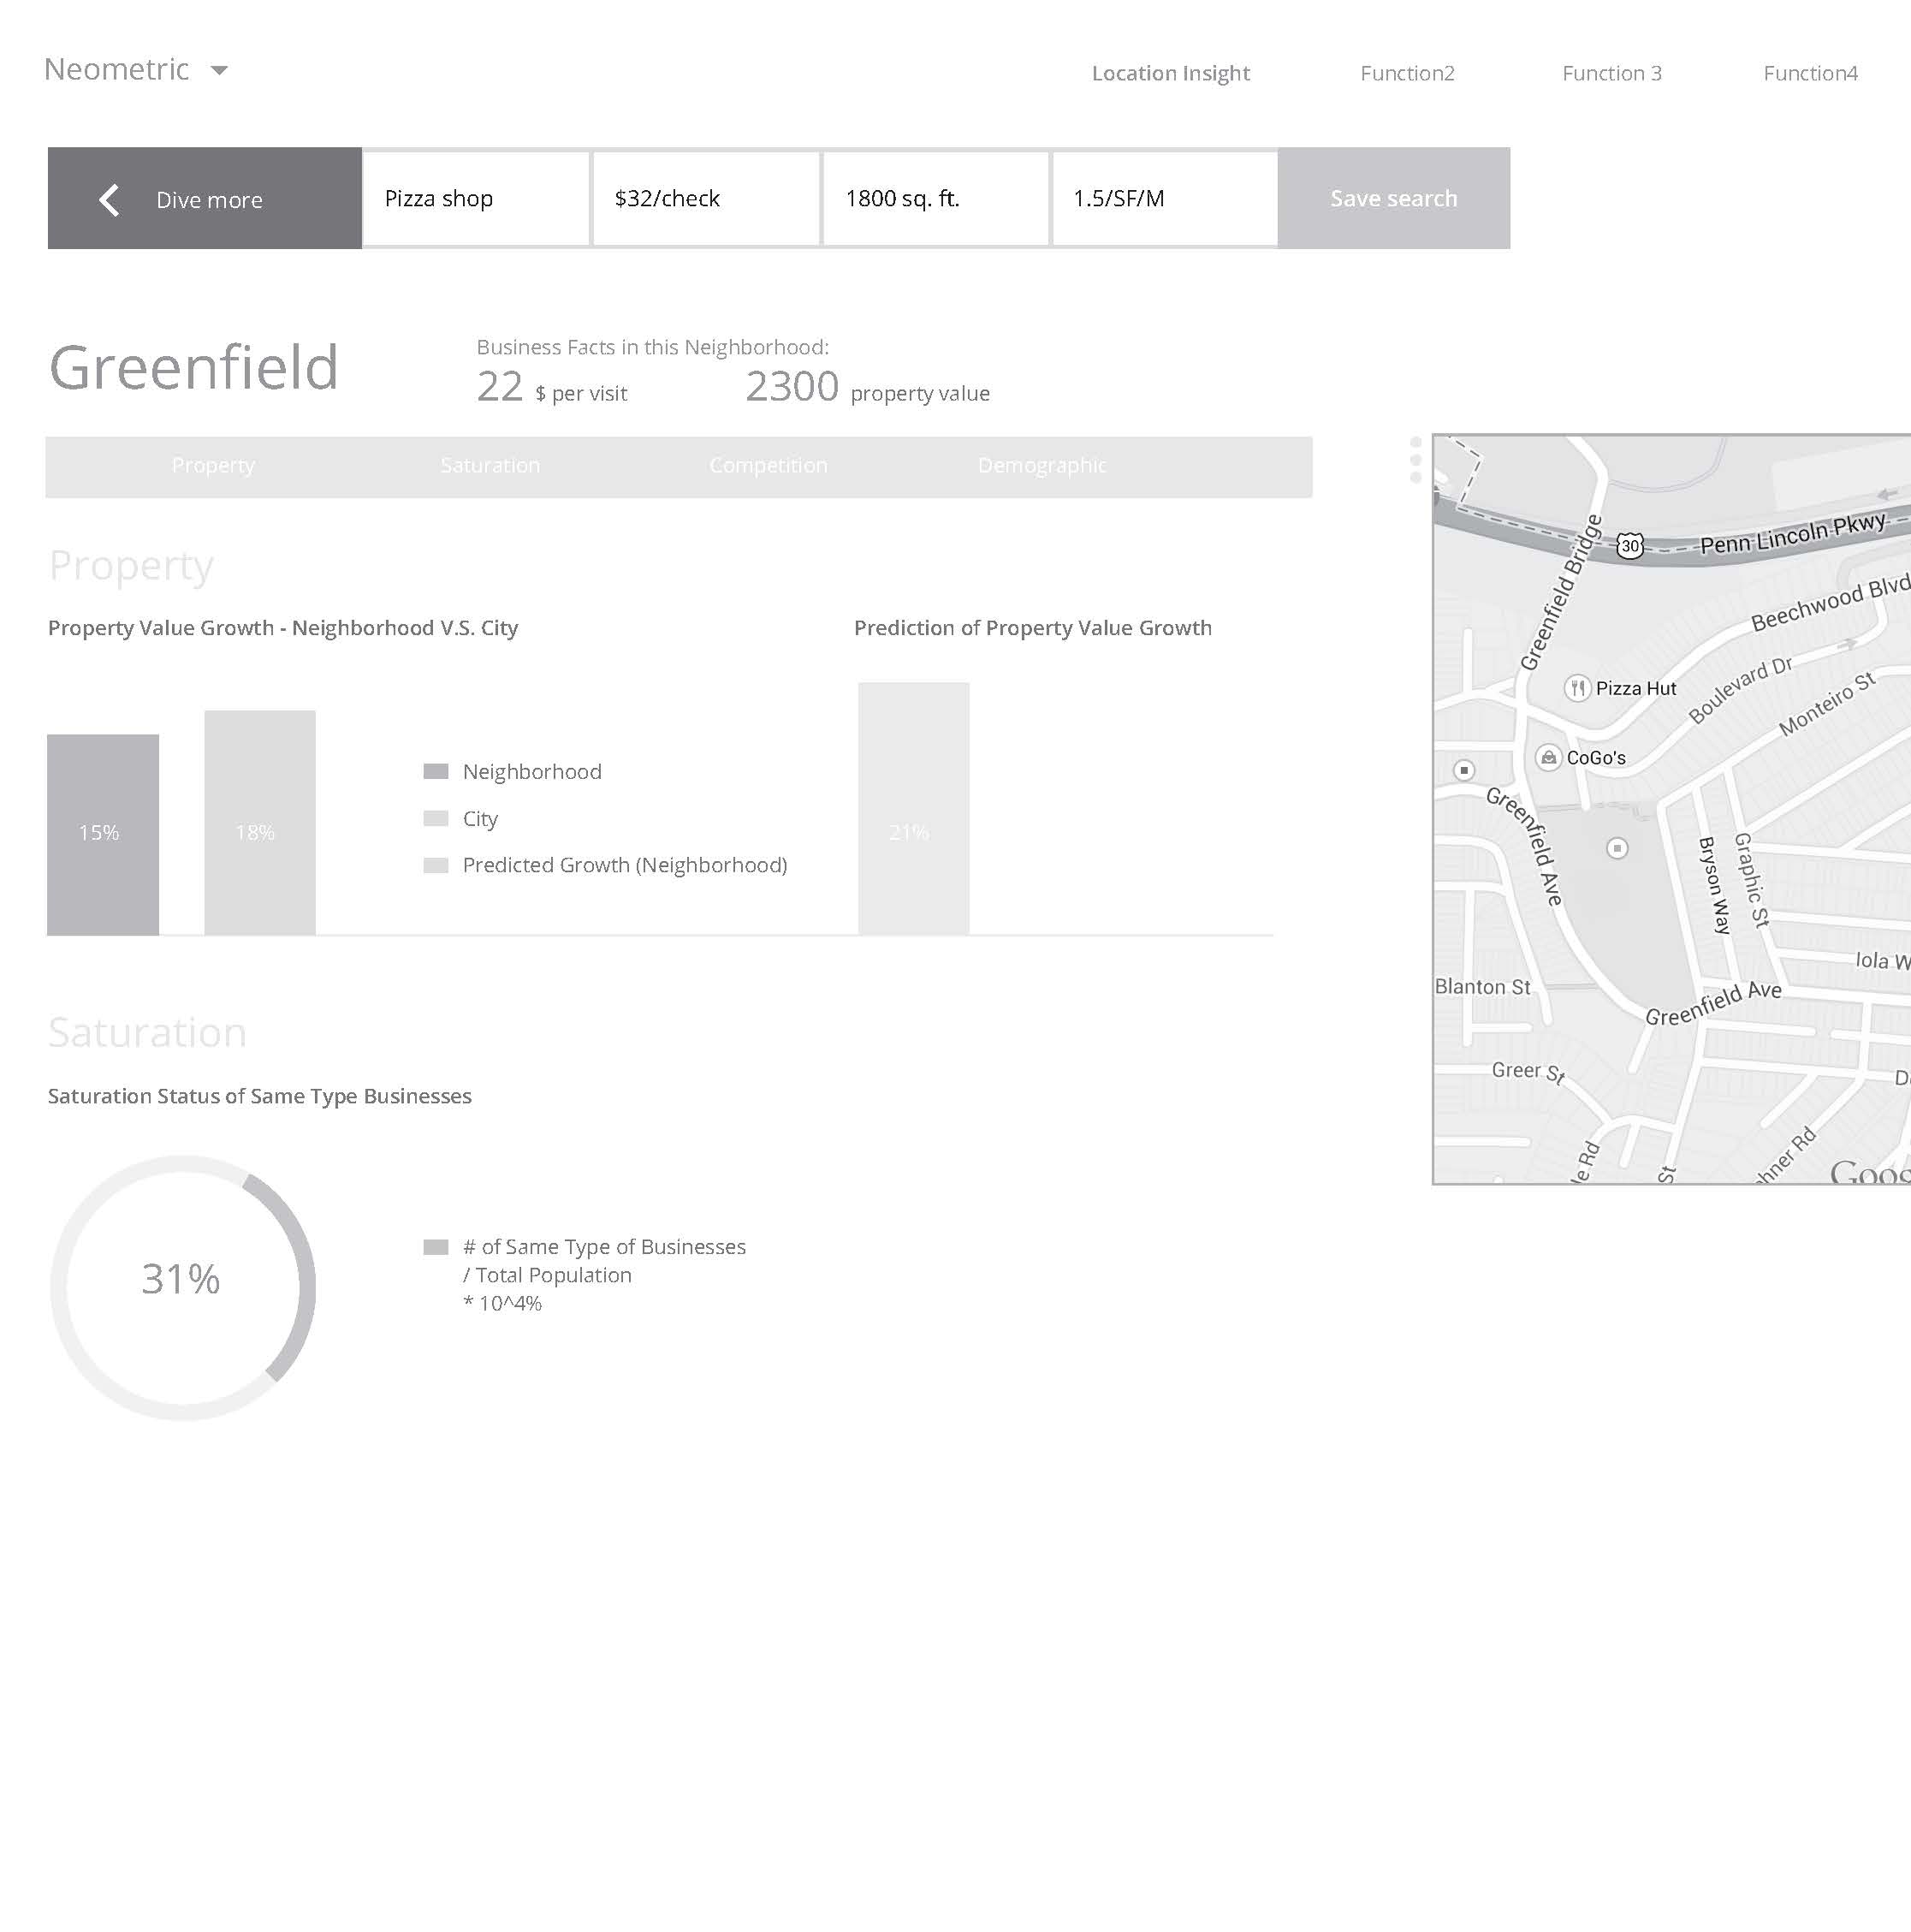
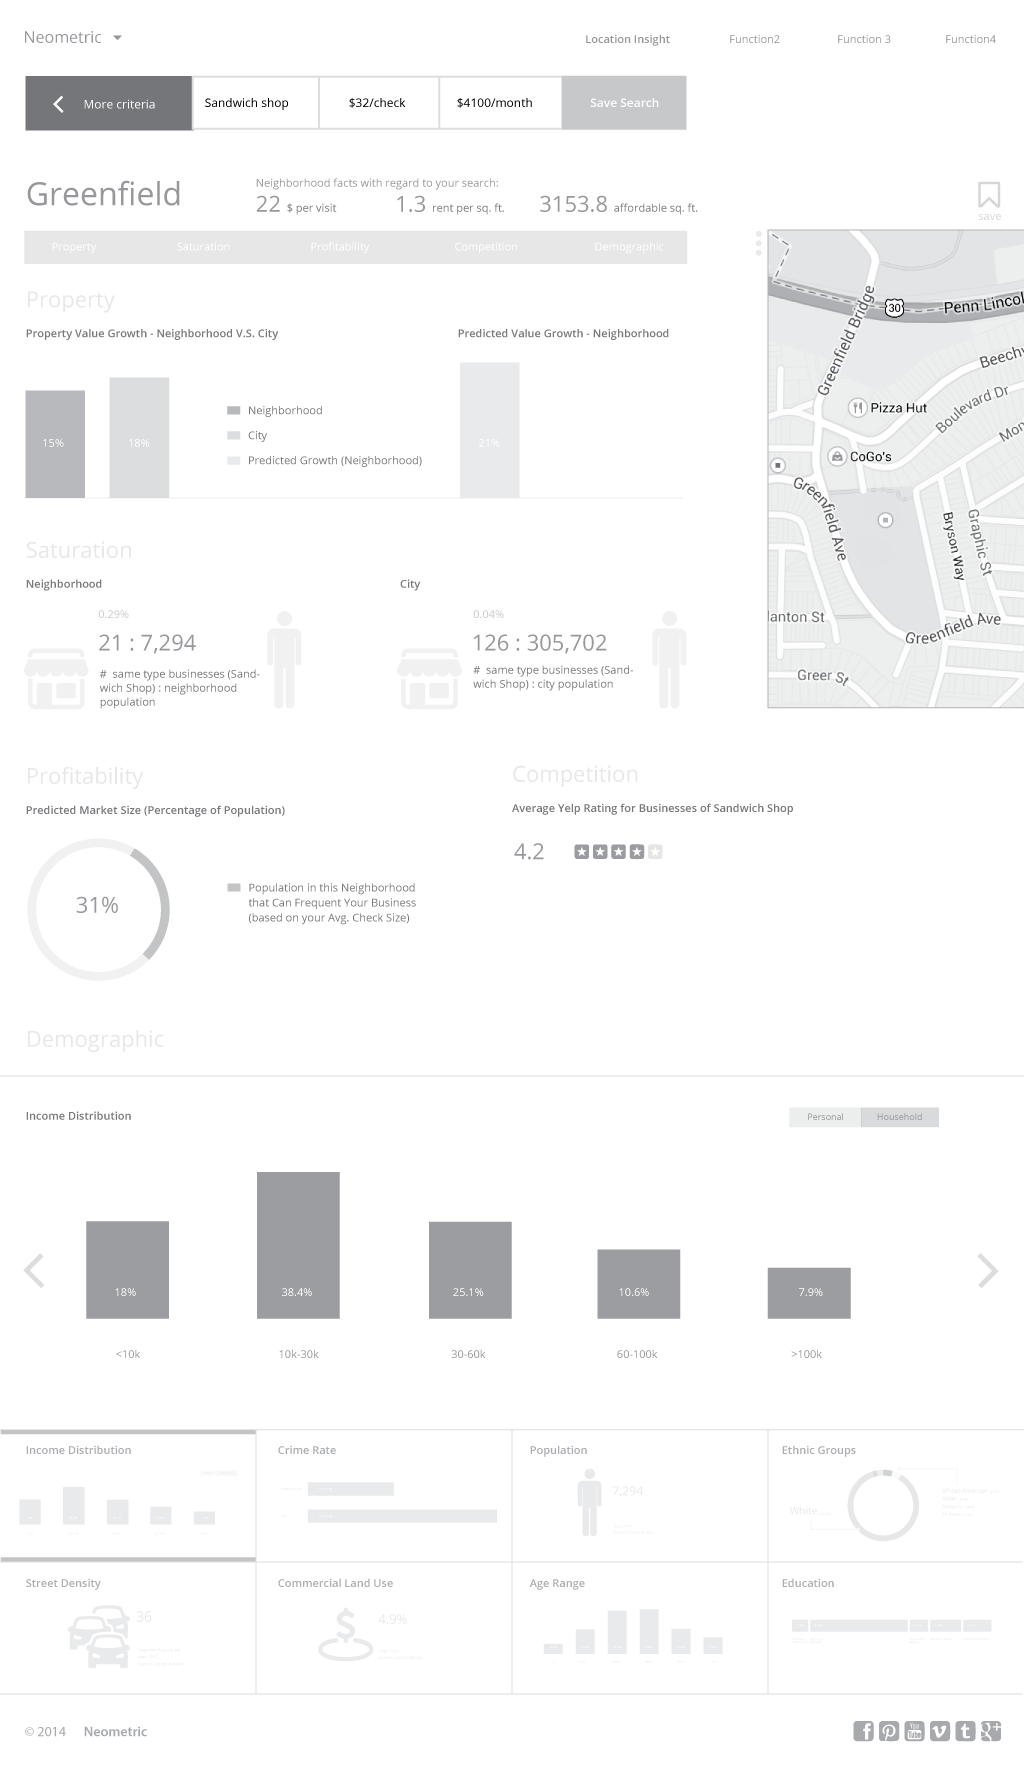
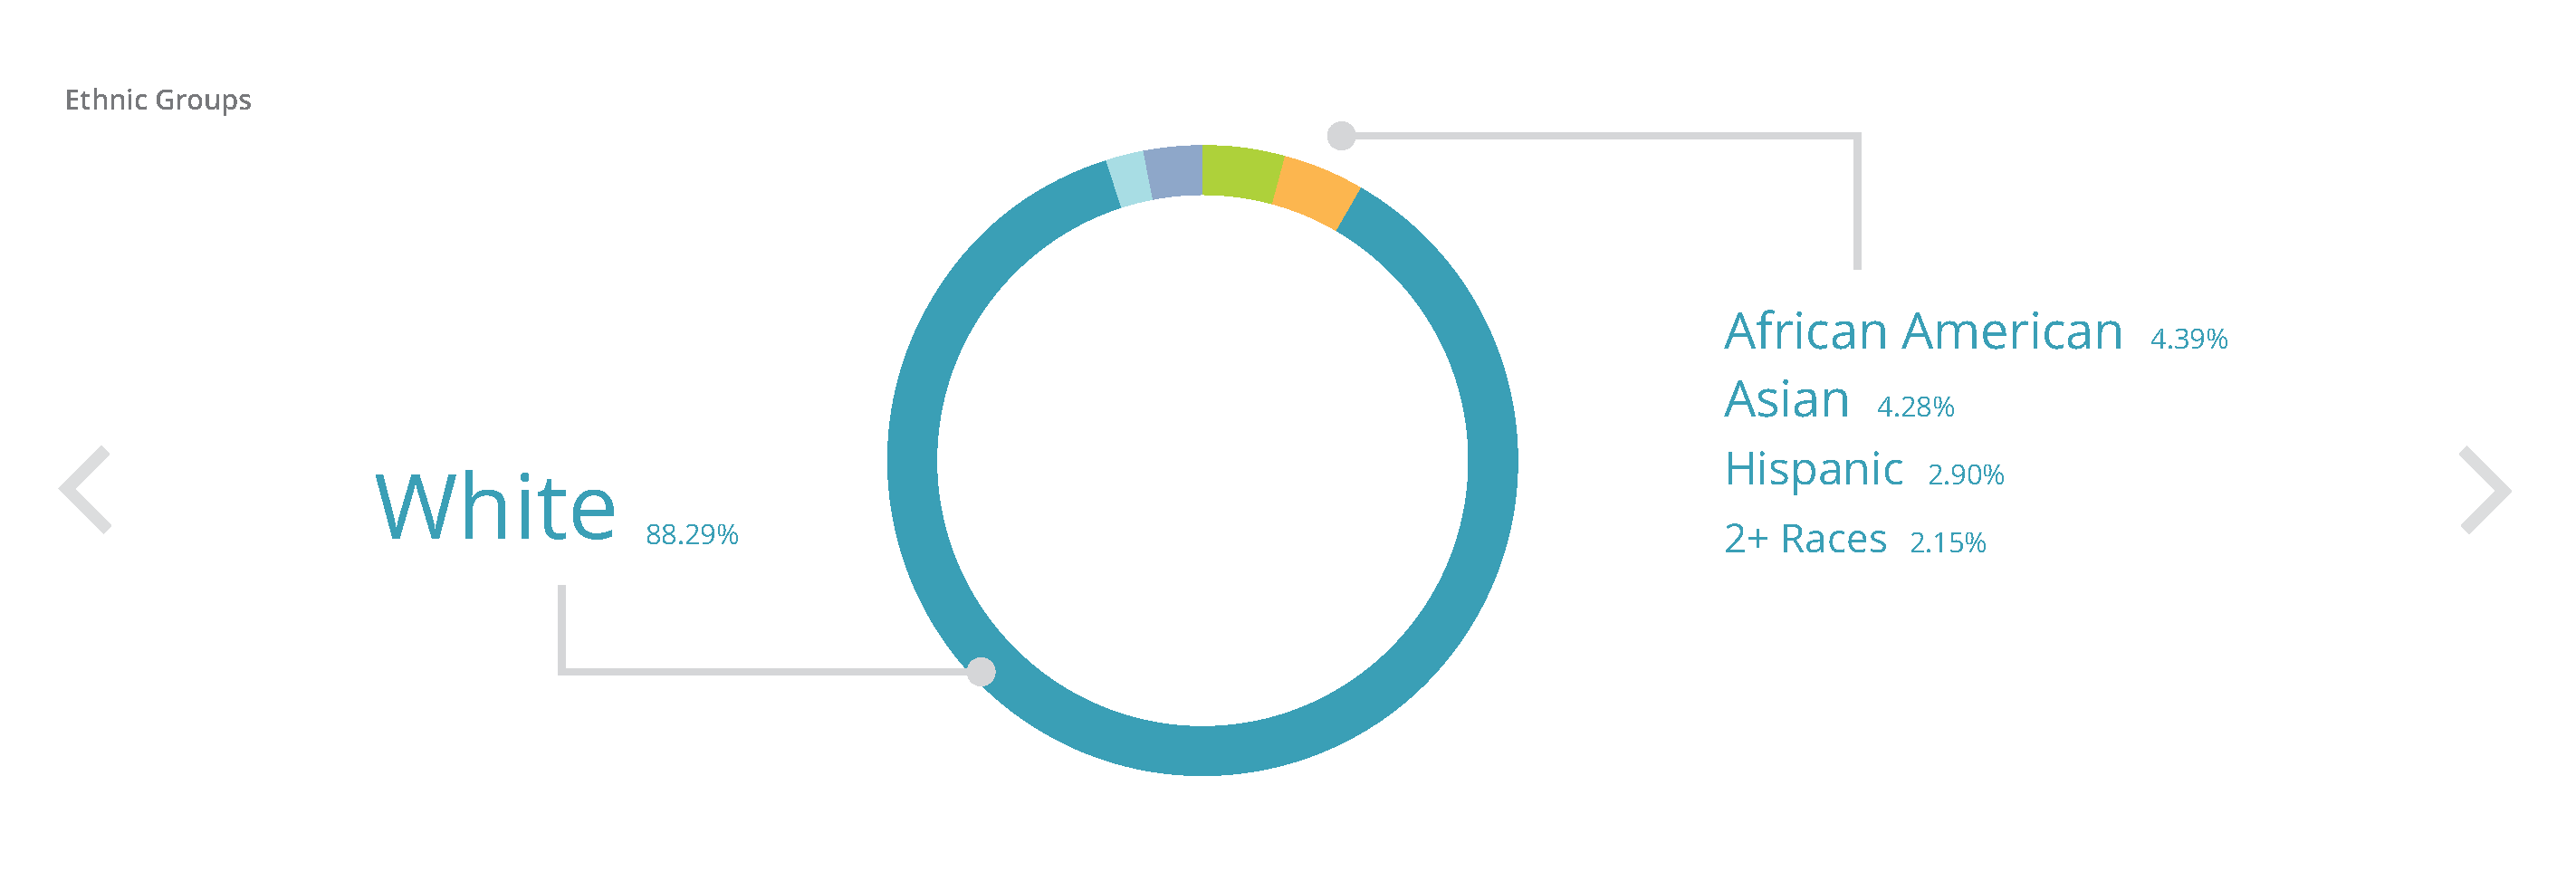
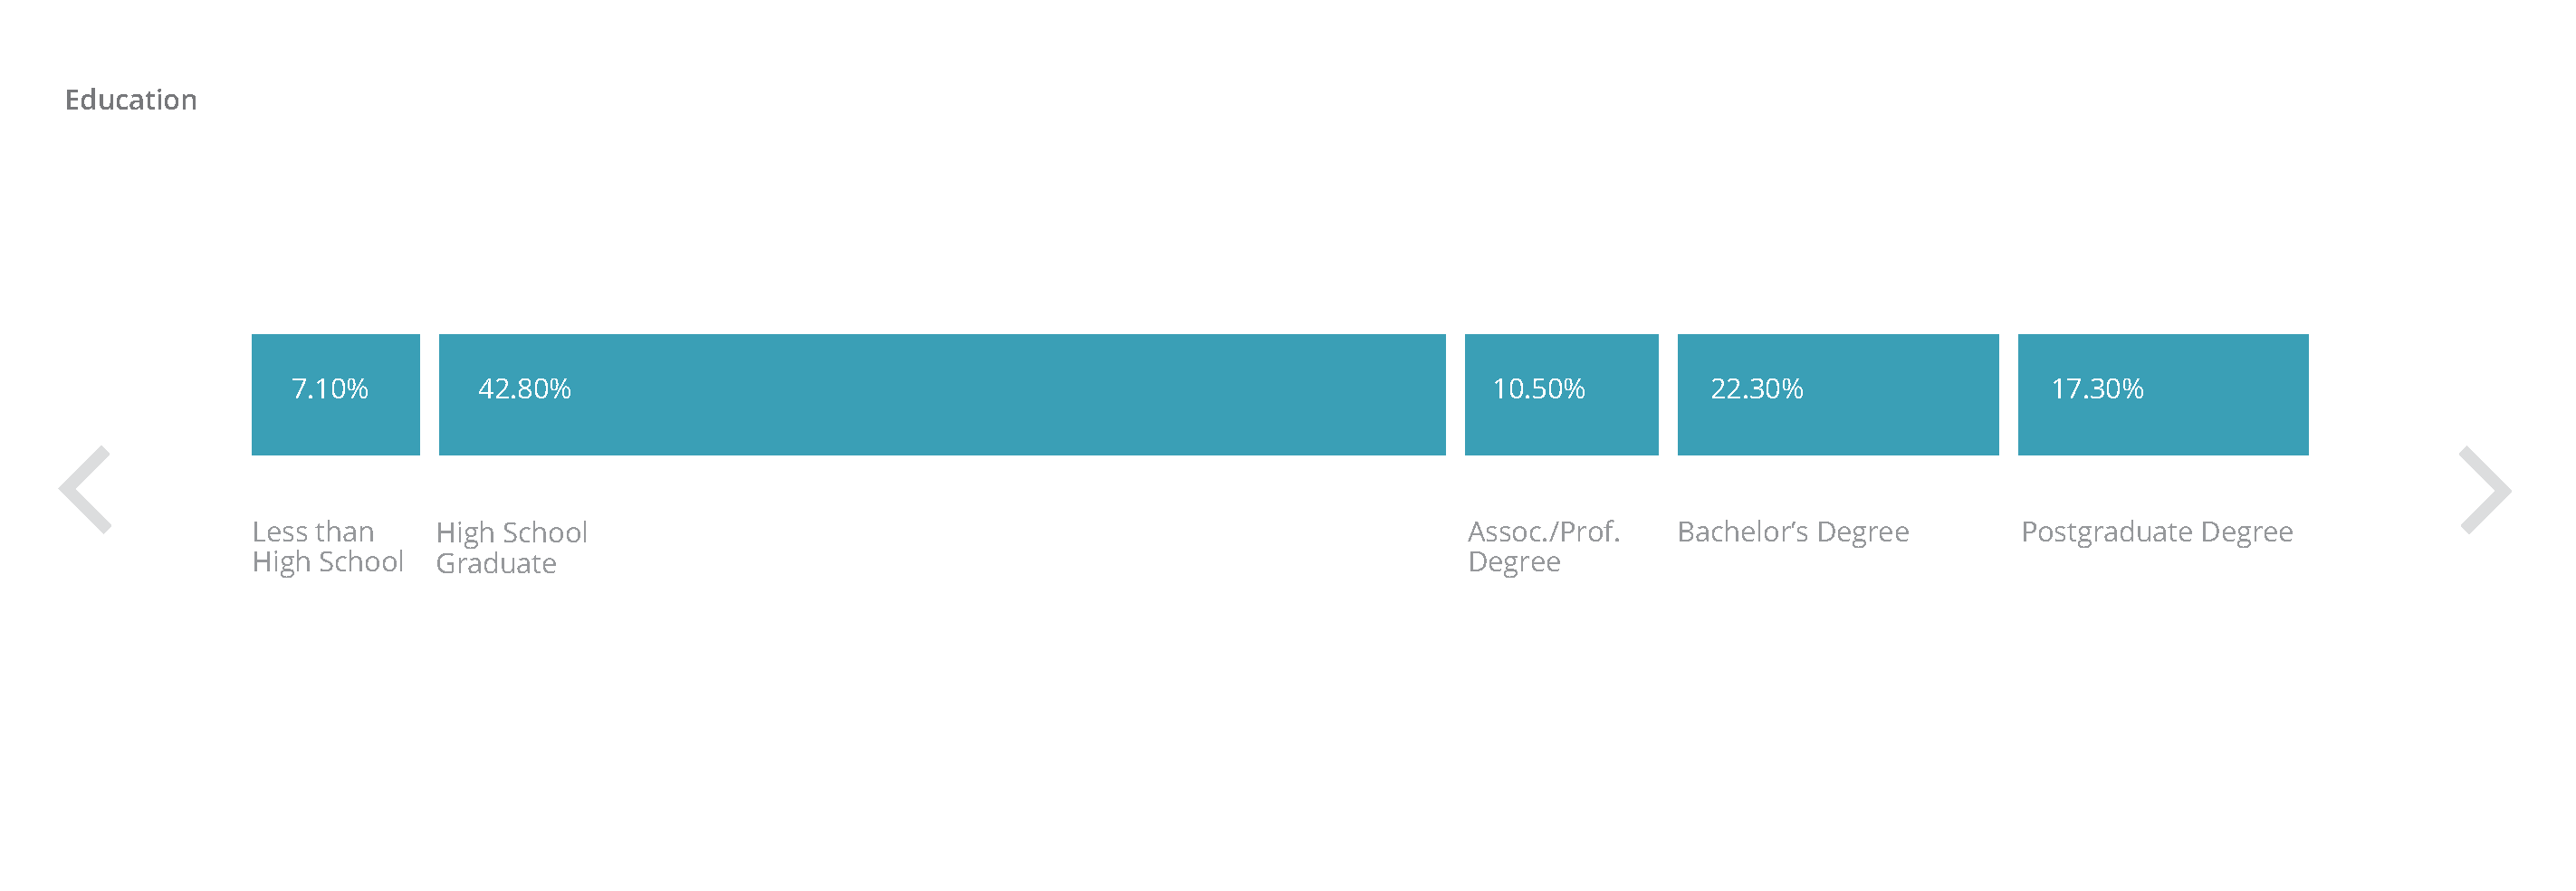
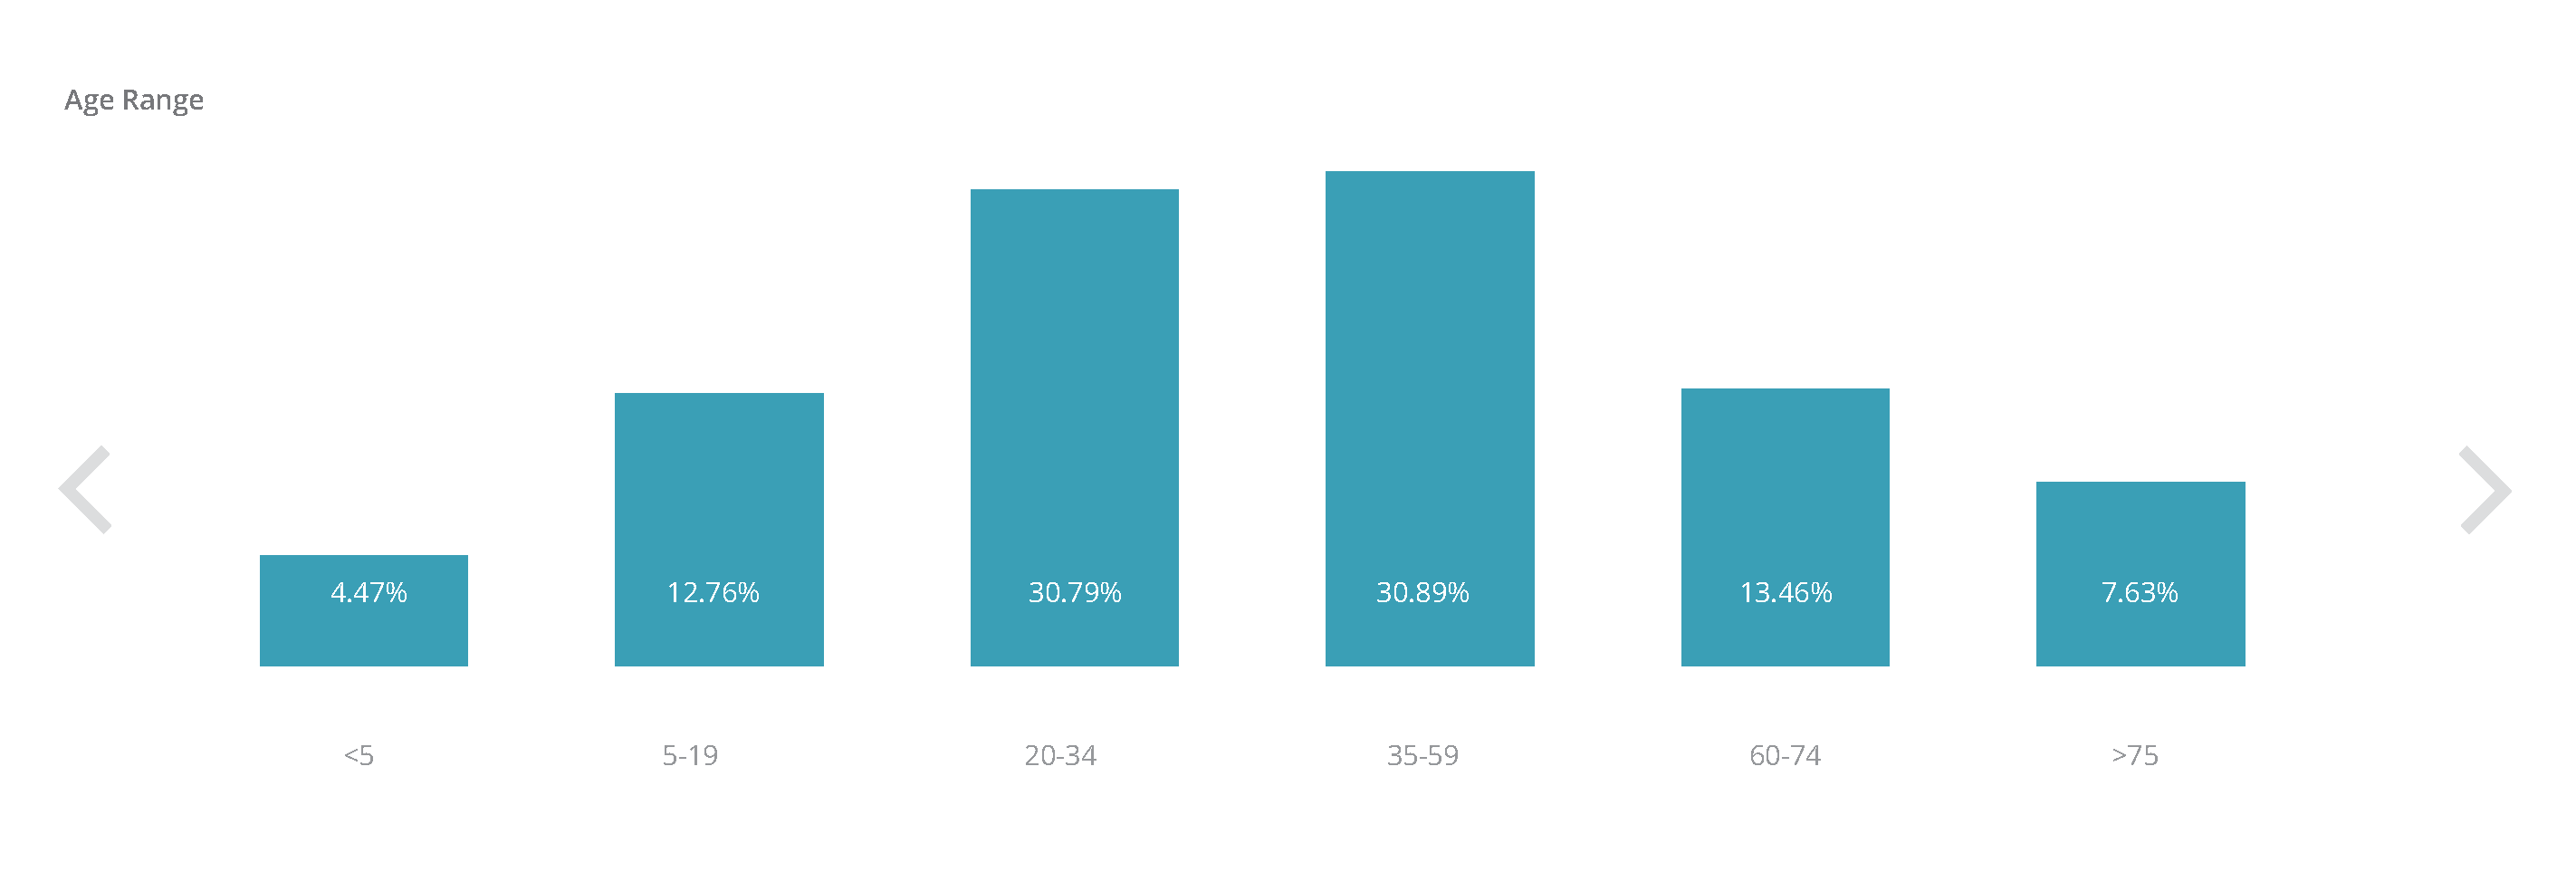
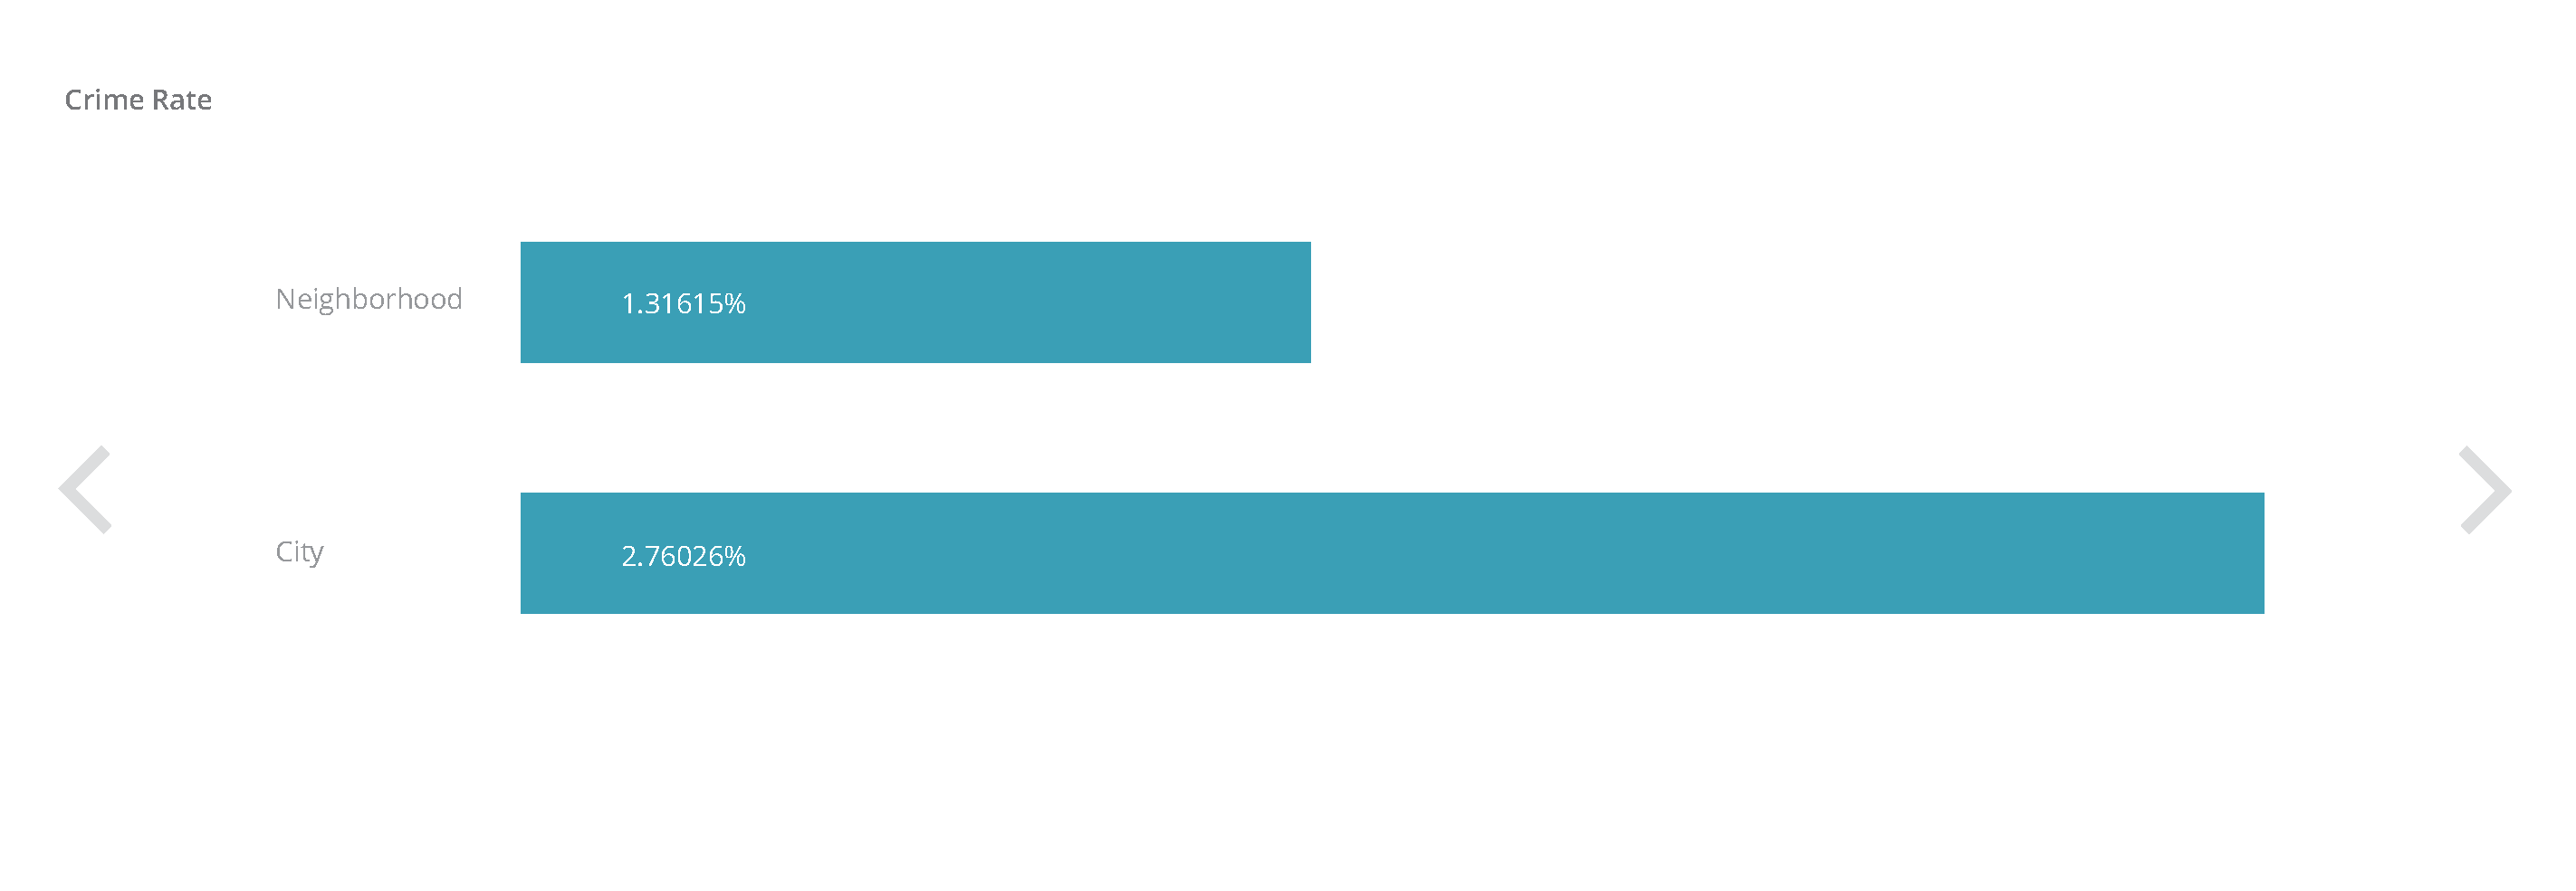
Data visualizations
As parts of the visualizations I created, these are included in the detail page to showcase demographics information, in a 1024×354 slider frame.


Final poster

